Zoltan Szuts here, reporting on the design of the cruise plan. Once we were accepted to the cruise training program, the first order of business was coming up with a cruise plan. The science directs research cruises, and depending on our sampling plans the ship would need to load onboard or install specific sampling instruments and the wire and hardware necessary to operate them.
All of us were interested in sampling around Astoria submarine canyon, at the mouth of the Columbia River, which meant we wouldn’t need to steam long distances to reach sampling sites. We also had much overlap for our desired sampling instruments: towing nets to capture specific organisms, dropping sediment corers to collect ocean mud and the organisms living in them, measuring water properties with water samples and electronic instruments, or measuring water velocity.
Everybody had specific goals to achieve, but it was relatively easy to combine them into shared sampling plans that maximized the amount of data collected. With only a 7 day cruise, one day of which was needed to transit to and from Newport, OR, each of our goals were relatively modest. The data we collect will complement our existing projects or form the nucleus of a new proposal.
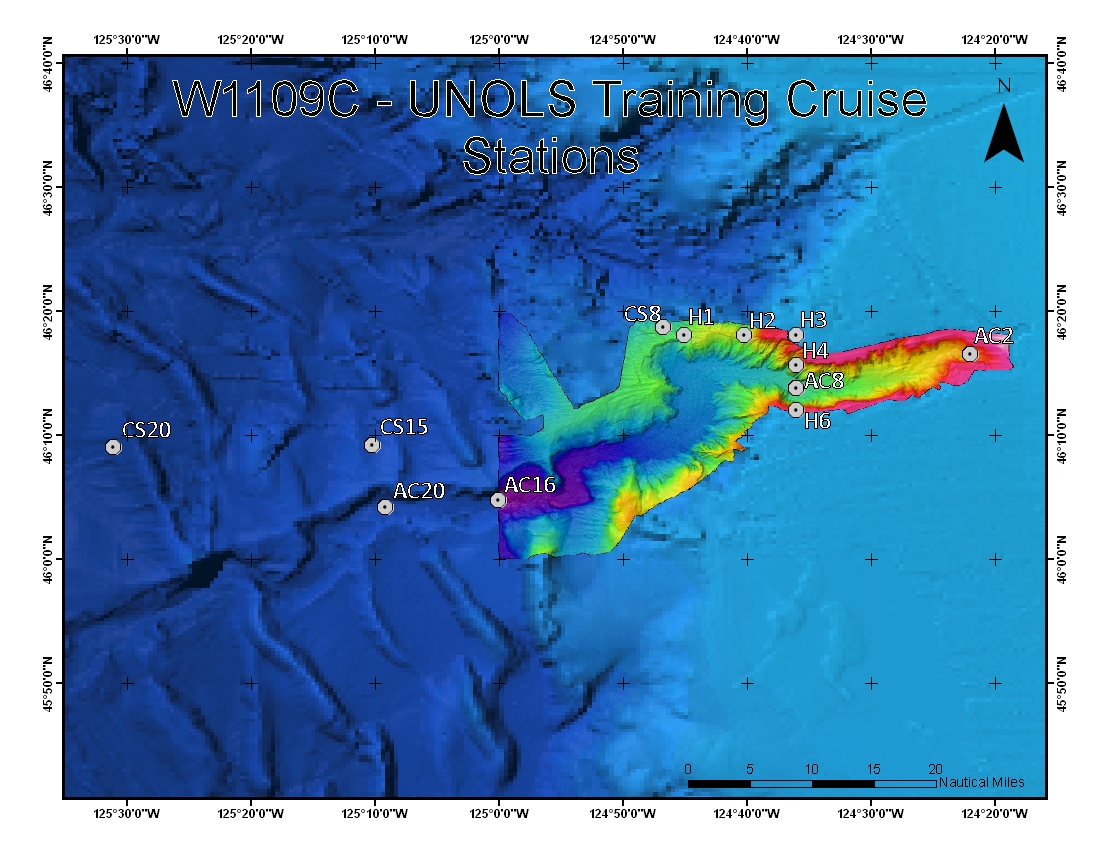
As co-chiefs, Sarah and I figured out an intial plan, that was subsequently modified multiple times. Before setting sail, the map below shows the stations we hoped to sample at.
- W1109C Station Map – By: Laurel Childress - Acknowledgment: Chris Romsos (OSU), Morgan Erhardt (OSU), Waldo Wakefield (NWFSC-NMFS) for providing base map bathymetry.
The initial cruise plan for W1109C. Stations are labeled by whether they are on the continental slope (CS) or in Astoria Canyon (AC), and also by the (expected) bottom depth in hundreds of meters (for instance, 8 for 800 m). The data collected by a seafloor mapping project (colored region) is of very high accuracy, and showed that some of the bottom depths were different than expected.
The people trawling for animals largely wanted pretty deep waters (1500-800 m) to find their uncommon animals of interest. The stations furthest offshore (CS20, AC20, CS15) were 2000-2500 m deep, and so were ideal for their long and deep trawls. These offshore stations also enabled a comparison between regions at the bottom of the canyon (AC20) versus those closer to its head (AC8, AC2). This was a key part for looking at the sedimentary layers and benthic fauna. A second contrast was between stations in the canyon (AC20, AC16, AC8, AC2) – where one might expect biodiversity and biomass to be higher – and stations outside of the canyon (CS15, CS8). This contrast is closely tied to the benthic environment, but also to the variety of deep organisms sampled. The people interested in water motion had variable objectives: the sea trials of a flow sensor didn’t require any specific location or time, whereas ocean currents are most interesting close to bathymetric features that deflect and distort them.
Now that we’re well underway, the plan has changed continuously based on our progress. An updated map will follow later, to show the stations at which we actually sampled!

