Archived Cruises

The information on this site is from the September 2011 Chief Scientist Training Workshop aboard the R/V Wecoma.  If you are looking for information on the current Chief Scientist Training Workshop please visit http://csw.unols.org.

Posted in Uncategorized | Leave a comment

Flow Sensor Testing

Hello there-

This is Heather Beem, mechanical engineering graduate student at MIT/WHOI, and I’m reporting on initial testing of a flow sensor I’ve built. Rather than trying to collect samples at a specific location or time of day, I simply need time in the water to test if my instrument works!

This is my first time to build something from the ground up that is able to withstand the marine environment. I’m  happy with how the design and fabrication has progressed, and am excited to bring this out of the lab and put it to the real test.

So why make a new flow sensor? Well, it’s been observed many times that biology has figured out clever mechanisms for accomplishing things that we’d like our own sensors/vehicles to be able to do. Specifically, it was recently noticed that harbor seals have unusually-shaped whiskers (they are wavy and asymmetric, instead of just a circular rod), and that these whiskers don’t seem to flop around while the seals are swimming.

I’ve spent time investigating this, by making my own seal-whisker shaped structure (scaled up) and measuring forces on this model in a water-filled towing tank. Indeed, at certain angles to the oncoming flow, the strange shape does largely suppress Vortex-Induced Vibrations, a classical fluid mechanics phenomenon (take any rod and drag it upright through some water- I guarantee you’ll notice the rod strongly vibrating!). Seals could be using this capability to aid in sensing various flow patterns (for ex, the wake of a fish it wants to eat).

This cruise has not only provided info that de-mystifies the ship time request procedures, but has also been a fantastic way for me to learn about all the things that go into making an ocean-going instrument. Each day I’ve encountered something that has turned into a learning opportunity: dealing with overheating, cracks in pressure housings, etc.

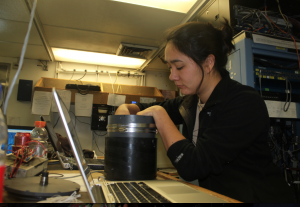
Loading components into the electronics housing

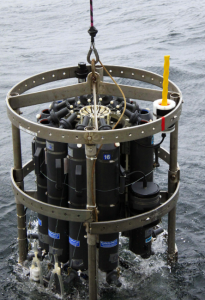
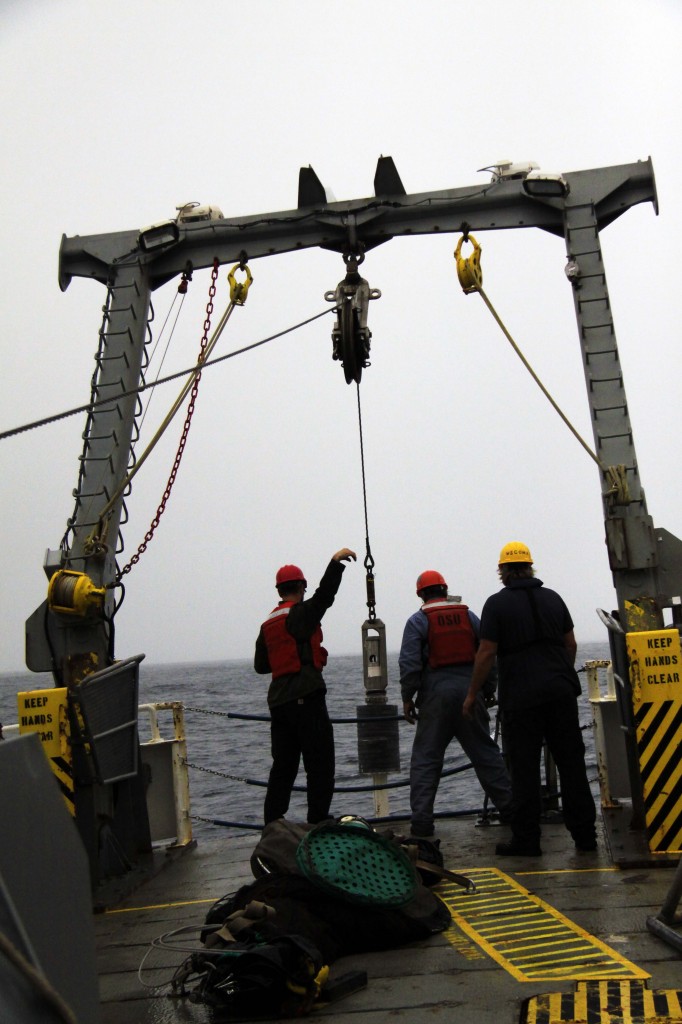
My sensor is mounted to the CTD rosette, making it a simple (though strange-looking) add-on to a standard piece of equipment that is already set up on the winch.

ready to deploy the sensor (the yellow piece is the "whisker") - photo by Paul Suprenand

entering the water - photo by Paul Suprenand


Playing with the mud

It’s also been fun and informative to lend a helping hand to the other operations, such as the mud coring (above).


Posted in Uncategorized | Tagged , | Leave a comment

Pteropods

Hi ho, oceanographer called Paul here, reporting on the pteropod (pelagic marine snail) situation.  It seems that there are many free-swimming marine snails!  One in particular called Limacina helicina keeps coming up in Tucker trawls, which are deployed from the back of the research vessel.  Limacina helicina can be found living near the ocean surface and up to 1600 meters of water depth.  Limacina helicina looks like grains of sand until they are magnified, revealing beautiful sinistrally coiled and semi-transparent shells (photograph below).

Pteropods make their shells out of a type of calcium carbonate called aragonite.  Aragonite is much like the calcium carbonate found in clams or mussels called calcite (another type).  A pteropod's aragonite shell reflects the chemical properties of the seawater in which they live.  So, with a little measuring of water column temperature and salinity with depth, along with a little measuring of stable isotopes of oxygen and carbon I can see at what depth(s) they make their shells and how ocean chemistry may influence them.  This helps me to understand how changes in the ocean are exhibited in the pteropod’s shell, potentially making pteropods indicators of environmental change.

Pteropodologist Paul Suprenand signing out…

Posted in Uncategorized | Leave a comment

Gravity Cores

This is Laurel Childress reporting in on gravity cores.  As part of my research to investigate the offshore and down-canyon transport of organic carbon we will be collecting several gravity and multi-cores from the upper, middle, and lower reaches of Astoria Canyon. Gravity cores are a tool we use to collect sediment from the deep sea. We lower a 10′ core tube on a line to the bottom and a set of weights drives the tube into the ocean floor. Unlike the multicorer, which deploys up to eight short tubes at a time, the gravity core brings back one long core.

Gravity Core Deploy - Photo by: Paul Suprenand

The first gravity core was collected Wednesday, September 21 at Station AC20. This station is located near the bottom of the canyon, and is the gravity core taken furthest from shore at 48 nautical miles offshore the mouth of the Columbia River. Coring was conducted in approximately 1650 meters water depth, however due to a mixture of very fine grained surface mud, large swells, and previous failed attempts to multi-core we were unsure of the recovery. The result was initially perplexing, as we obviously had good penetration, but did not seem to have recovered much sediment (only 81 cm).  We split the core in two with one half to be archived at OSU and the other half photographed, described, sub-sampled and frozen for later analysis.

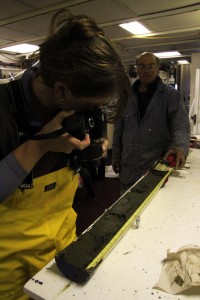
Documentation - Photo by: Paul Suprenand

Upon examining the split core the reason for our short core became immediately apparent; multiple layers of very coarse, up to pebble sized material. Based on the history of the canyon and we suspect these are turbidite layers, most likely associated with a major event in the Columbia River basin. Turbidites are rocks, sediment, and other debris that gets shaken loose during an earthquake or similar major event and tumble down slope. Turbidite layers are useful because they are distinct events in the geological record that can be correlated across regions giving a time thumbprint to the sediment. Further coring in the upper reaches of the canyon will occur in the coming days and will hopefully enlighten us further on the offshore reach of such event layers.

Posted in Uncategorized | Leave a comment

Cruise track planning

Zoltan Szuts here, reporting on the design of the cruise plan. Once we were accepted to the cruise training program, the first order of business was coming up with a cruise plan.  The science directs research cruises, and depending on our sampling plans the ship would need to load onboard or install specific sampling instruments and the wire and hardware necessary to operate them.

All of us were interested in sampling around Astoria submarine canyon, at the mouth of the Columbia River, which meant we wouldn’t need to steam long distances to reach sampling sites.  We also had much overlap for our desired sampling instruments: towing nets to capture specific organisms, dropping sediment corers to collect ocean mud and the organisms living in them, measuring water properties with water samples and electronic instruments, or measuring water velocity.

Everybody had specific goals to achieve, but it was relatively easy to combine them into shared sampling plans that maximized the amount of data collected.  With only a 7 day cruise, one day of which was needed to transit to and from Newport, OR, each of our goals were relatively modest. The data we collect will complement our existing projects or form the nucleus of a new proposal.

As co-chiefs, Sarah and I figured out an intial plan, that was subsequently modified multiple times.  Before setting sail, the map below shows the stations we hoped to sample at.
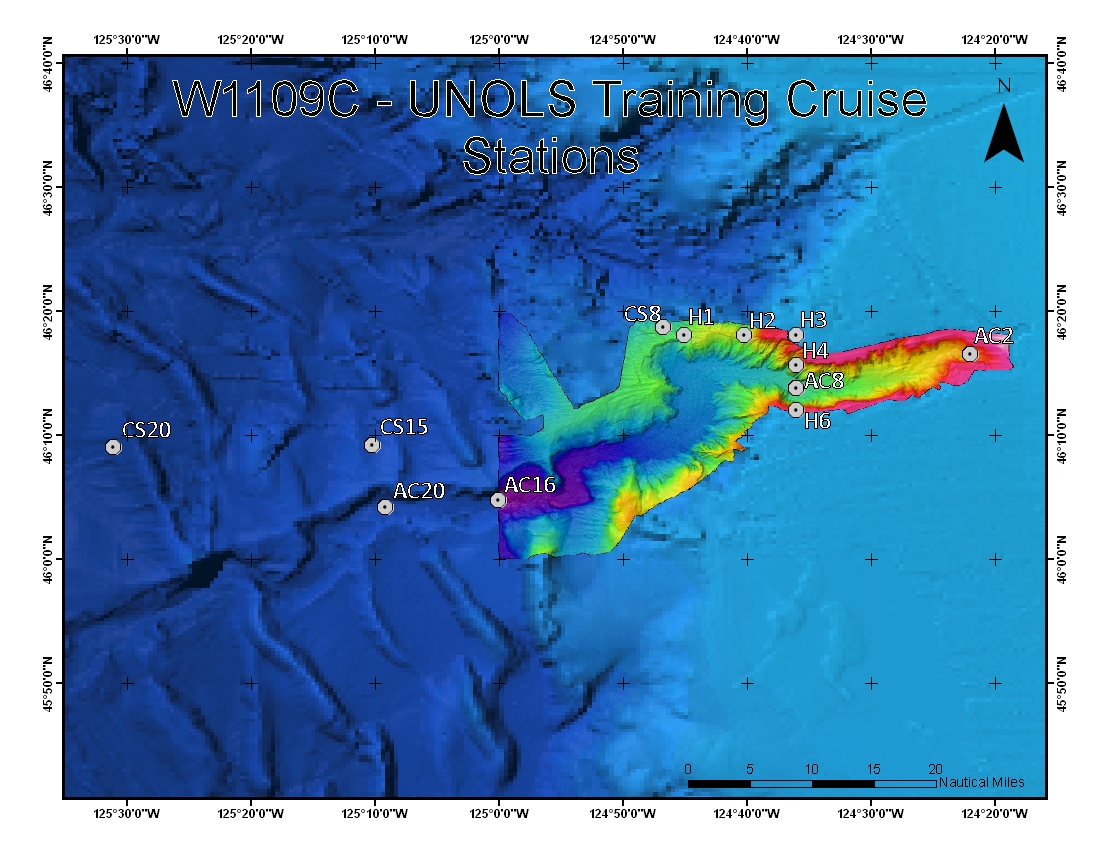
W1109C Station Map – By: Laurel Childress  -  Acknowledgment: Chris Romsos (OSU), Morgan Erhardt (OSU), Waldo Wakefield (NWFSC-NMFS) for providing base map bathymetry.

The initial cruise plan for W1109C.  Stations are labeled by whether they are on the continental slope (CS) or in Astoria Canyon (AC), and also by the (expected) bottom depth in hundreds of meters (for instance, 8 for 800 m).  The data collected by a seafloor mapping project (colored region) is of very high accuracy, and showed that some of the bottom depths were different than expected.

The people trawling for animals largely wanted pretty deep waters (1500-800 m) to find their uncommon animals of interest.  The stations furthest offshore (CS20, AC20, CS15) were 2000-2500 m deep, and so were ideal for their long and deep trawls.  These offshore stations also enabled a comparison between regions at the bottom of the canyon (AC20) versus those closer to its head (AC8, AC2).  This was a key part for looking at the sedimentary layers and benthic fauna.  A second contrast was between stations in the canyon (AC20, AC16, AC8, AC2) – where one might expect biodiversity and biomass to be higher – and stations outside of the canyon (CS15, CS8).  This contrast is closely tied to the benthic environment, but also to the variety of deep organisms sampled.   The people interested in water motion had variable objectives: the sea trials of a flow sensor didn’t require any specific location or time, whereas ocean currents are most interesting close to bathymetric features that deflect and distort them.

Now that we’re well underway, the plan has changed continuously based on our progress.  An updated map will follow later, to show the stations at which we actually sampled!


Posted in Uncategorized | Leave a comment

Pre-cruise

Hello! Amy Maas here, one of the early career investigators involved with the UNOLS training cruise from September 18th – 25th. This cruise is an opportunity for me and 13 other scientists to learn the ins and outs of planning a research expedition. We applied for this competitive opportunity on April 15th and found out by the end of the month that we were going out to sea aboard the Research Vessel Wecoma.

That is when the work began. Two co-chief scientists were chosen from among our number to lead the coordination effort of 14 very different research projects. Our science ranges from studying internal waves, testing a new flow sensor, biology of midwater invertebrates, biogeochemistry of the marine environment, and benthic biodiversity. We then collaborated to schedule shipments, request onboard equipment, pick a cruise track, and split up the operations to ensure that everyone would have opportunities to get some good data. By September we had our cruise plan in order and were ready to embark!


The coast of Newport Orgeon. Photo by: Paul Suprenand


Our travels began on the 15th of September when we all arrived in Newport Oregon to spend a quiet evening recovering from a day of long hours cramped in cars and planes. On the 16th we met in the Hatfield Marine Science Center of Oregon State University to talk with representatives of the UNOLS fleet and the Deep Submergence Facilities – two groups who provide shared resources for conducting science in the ocean and Great Lakes. The representatives gave us some great background on research vessels and tools available to the scientific community. There were some great discussions of the do’s and don’ts of cruise planning and some tips on how to plan a smooth and successful cruise. The biggest take home message from the day was that there are a lot of people ready to support ship-going research that are more than willing to share their expertise and facilitate our investigations. Communication, as always, is the key. Following our introduction we got a top to bottom tour of the facilities and the R/V Wecoma.

The back deck of the R/V Wecoma. Photo by Craig McClain

The R/V Wecoma will be our home and our research platform for the next seven days. To get an idea of how the planning works and to see pictures and descriptions of the ship check out their website at: http://www.shipops.oregonstate.edu/ops/wecoma/

Keep posted to see how the science unfolds!
If you want to see where we are check us out at: http://webcam.oregonstate.edu/wecoma/

Posted in Uncategorized | Leave a comment