Plate tectonics, subduction zones, and seismic reflection profiling: My research de-jargoned

By Emily Schottenfels

This post is for those who would like a basic explanation of why I’m on a research ship off the coast of Oregon.

Deploying seismic instruments from the R/V Revelle. Photo: Rebecca Fowler

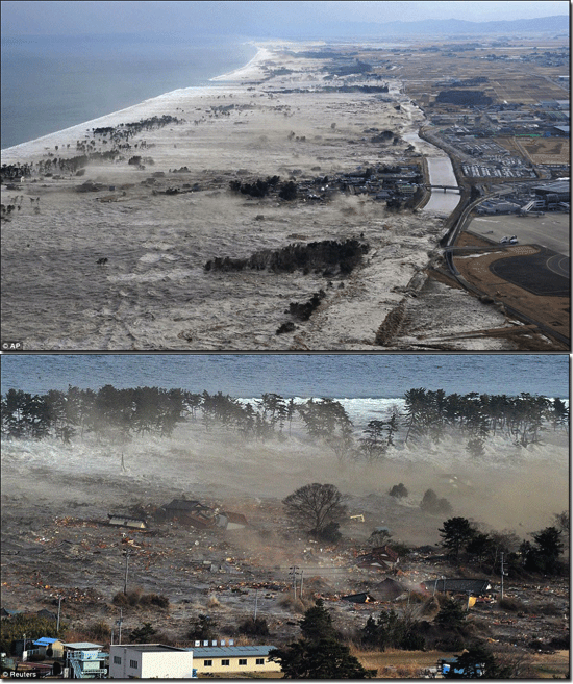
The 2011 magnitude 9 earthquake off the coast of northeast Japan was the largest recorded earthquake in Japan’s history. The U.S. Pacific Northwest (PNW) is prone to similar large earthquakes (recall the New Yorker article, “The Really Big One”).

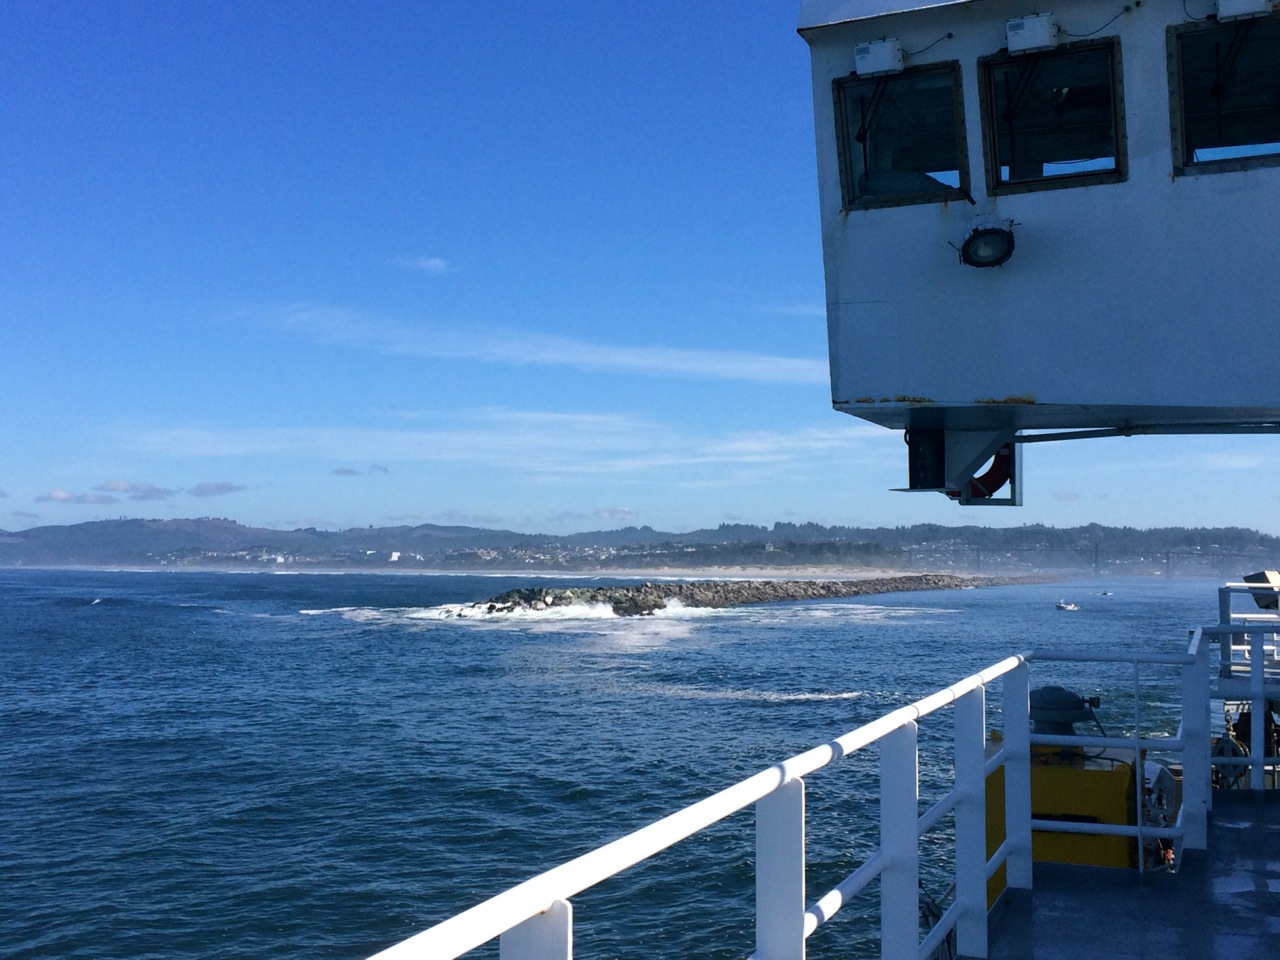
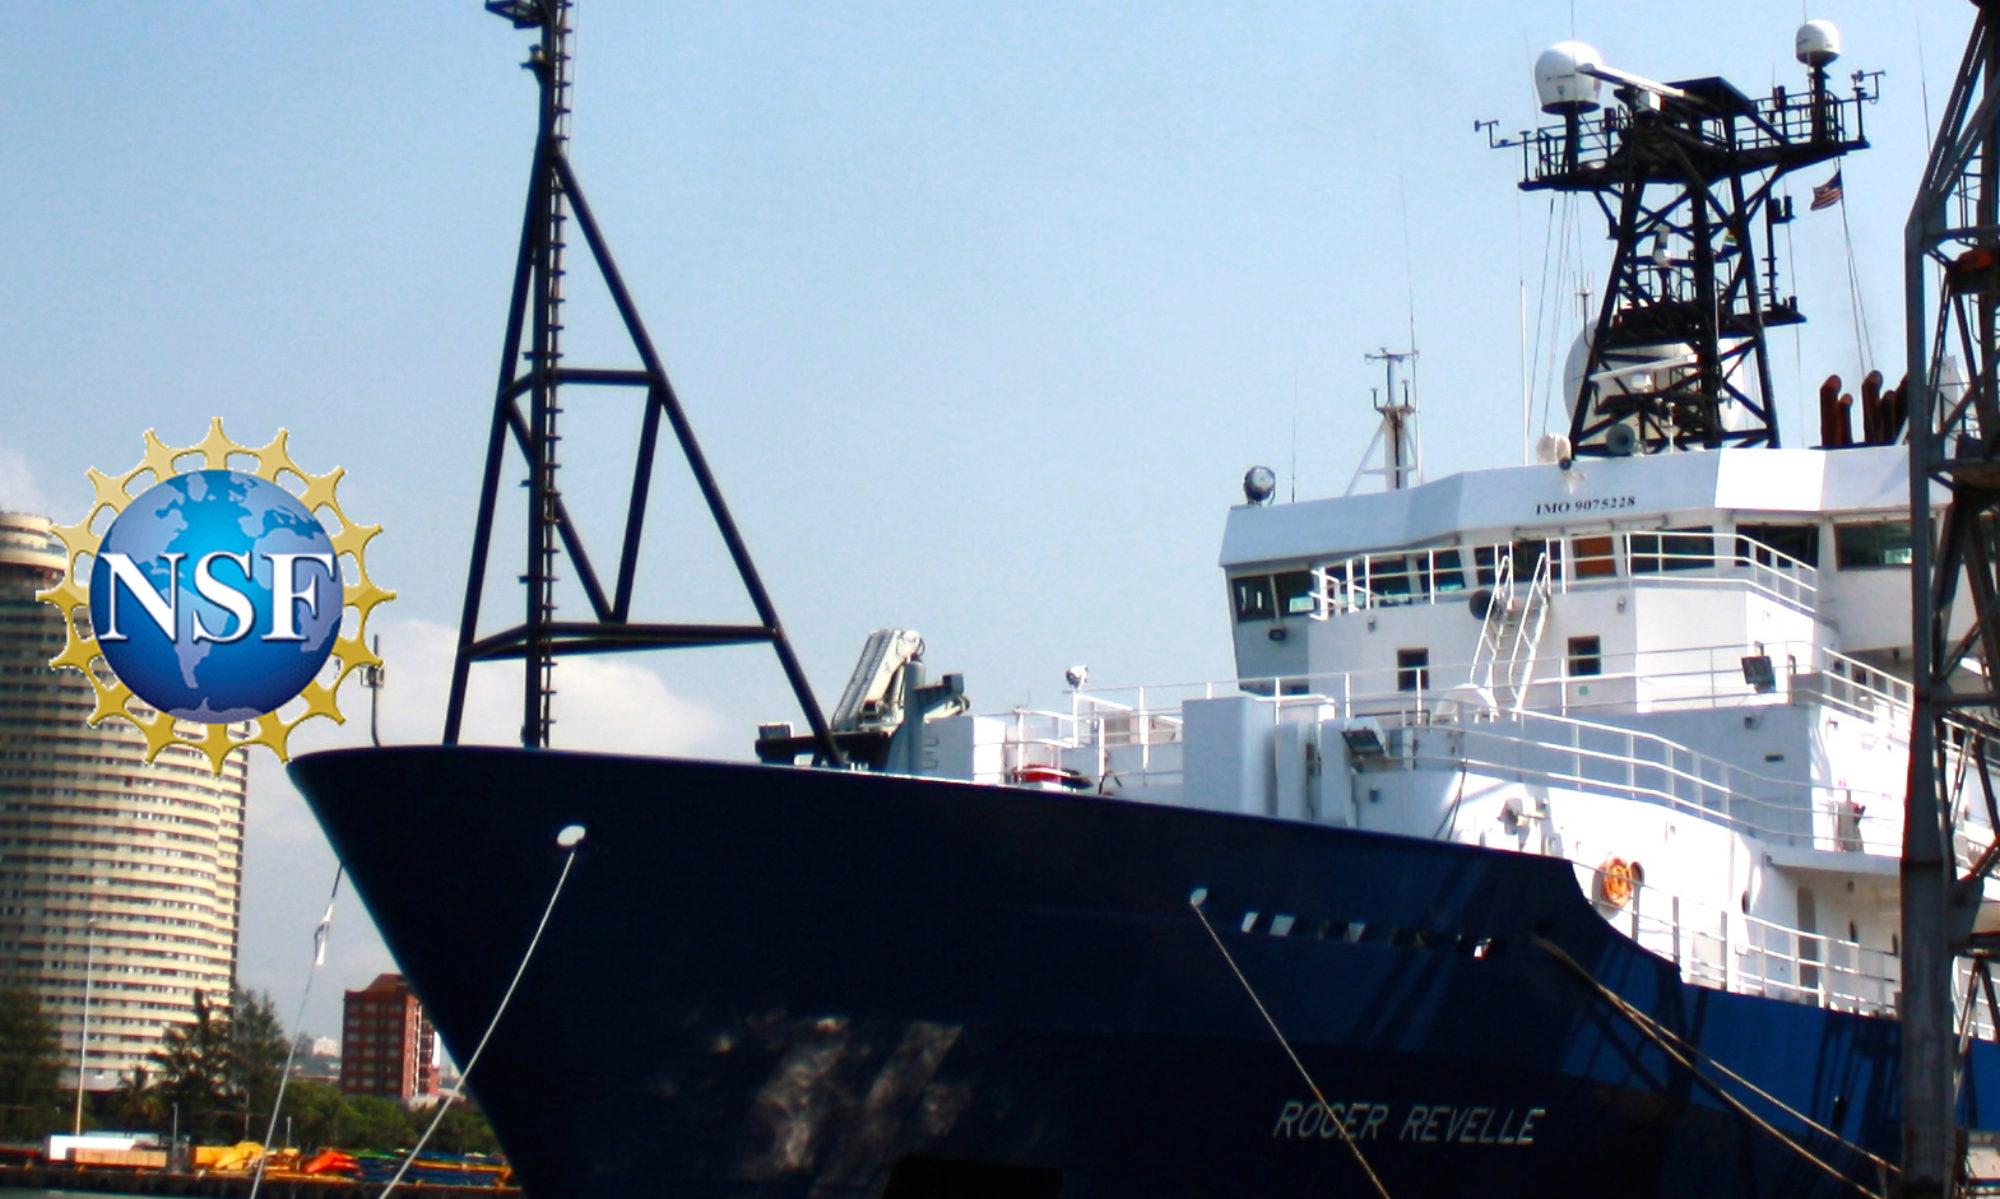
As a graduate student, I research the geology of these two regions. I spend a lot of time staring at “images” on a computer screen to understand how the geology below the seafloor can allow for large earthquakes, which are often followed by tsunamis. I’m now located on the R/V Roger Revelle off the PNW coast where I’m learning firsthand how to take these images of earth’s subsurface, and to successfully plan and execute a research expedition. Here’s a breakdown of the science behind this expedition.

The earth’s crust is cracked and composed of several moving pieces called “plates.” The plates move around, and the type of interaction defines the plate boundary. Generally, plates can (1) move away from one another (divergent boundary), (2) move towards one another (convergent boundary), or (3) move side by side (strike-slip or transform boundary, i.e. San Francisco). Continents are on “continental plates” and oceans are on “oceanic plates.” Geologists are sometimes good at naming things.

Earth’s plates. Credit: USGS

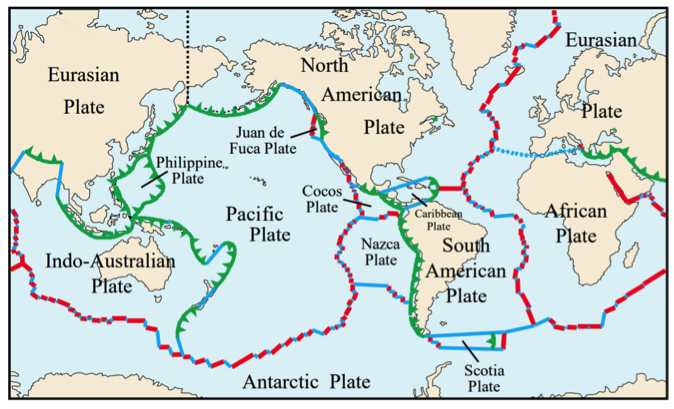
Oceanic plates are denser and thinner, and in convergent boundaries they can slide beneath continental plates, also called a “subduction zone.” However, the plates don’t just slide continuously over time. The plates stick to each other, build up energy, and release the energy in bursts — these are the large earthquakes. These types of plate boundaries, where Japan and the PNW are located (also places like Chile, Mexico, and New Zealand), create the largest earthquakes. Our current location off the coast of the PNW is where the Juan de Fuca (oceanic) plate slides beneath the North American (continental) plate. I’m trying to take a snapshot image of this geologic process.

When subduction zone earthquakes occur, the front of the upper continental plate moves upward and forward. The entire water column above and in front of the seafloor, which can be up to thousands of square miles, moves with the plate, resulting in a tsunami.

GIF via GIPHY

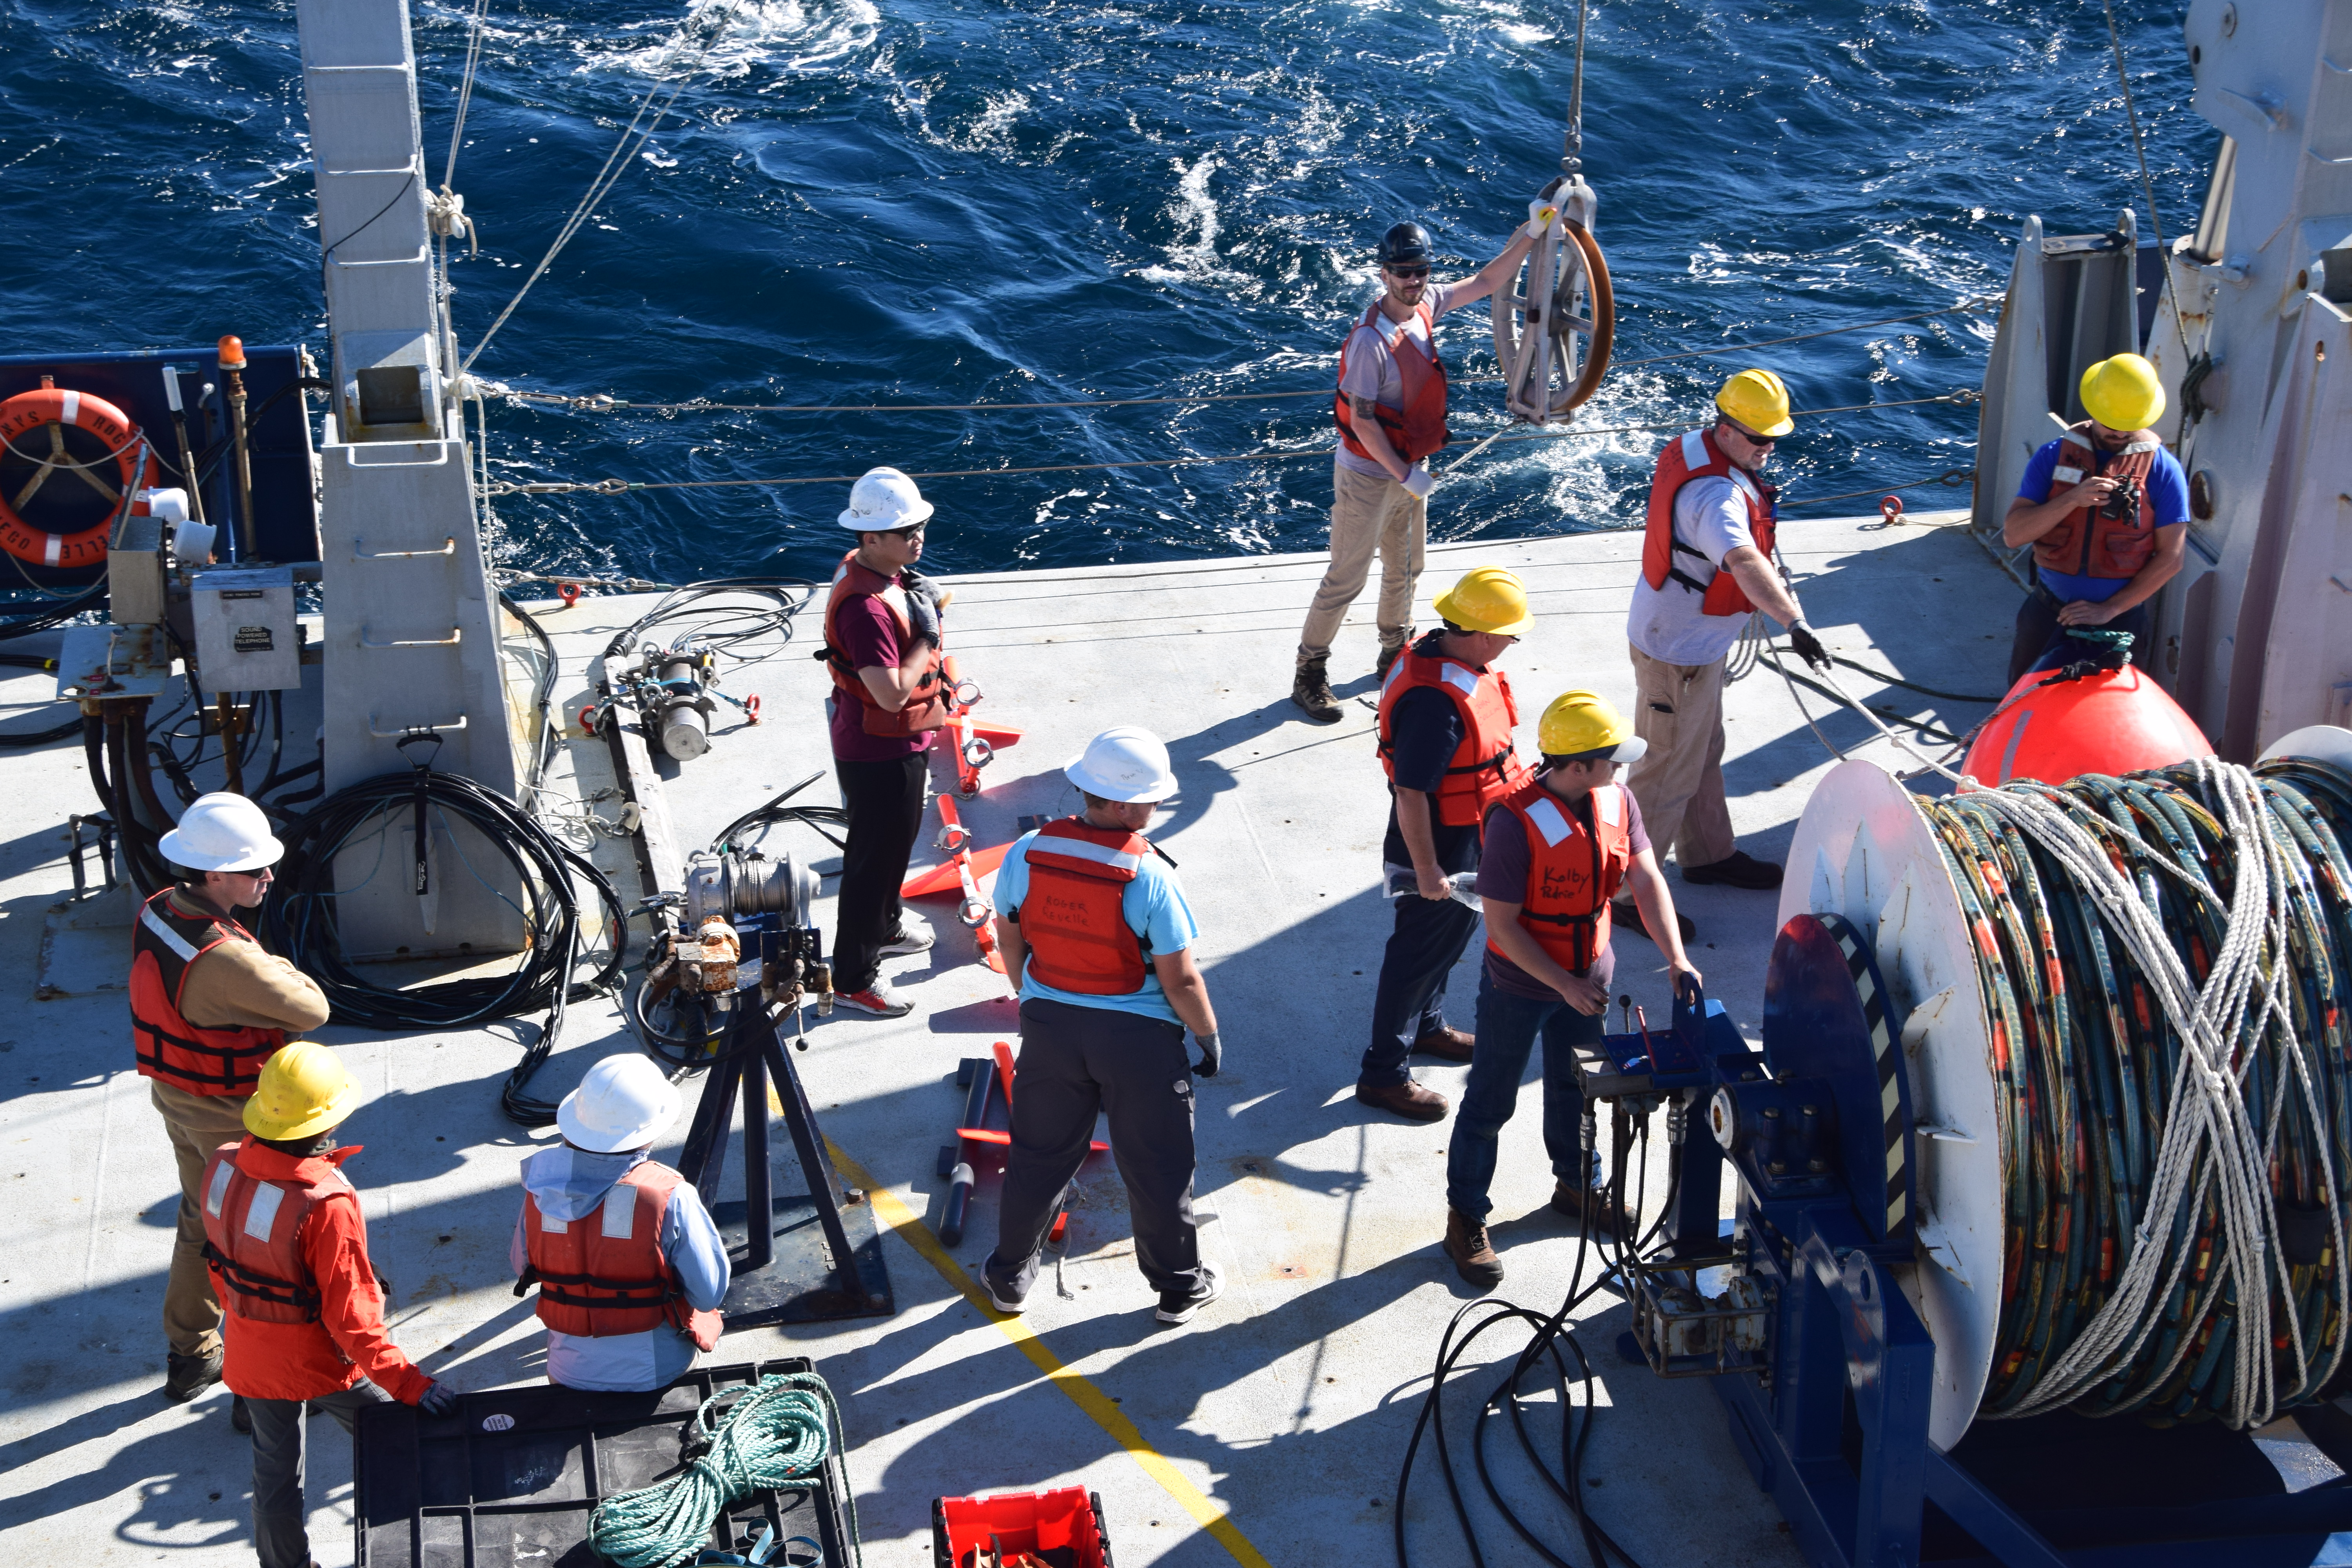
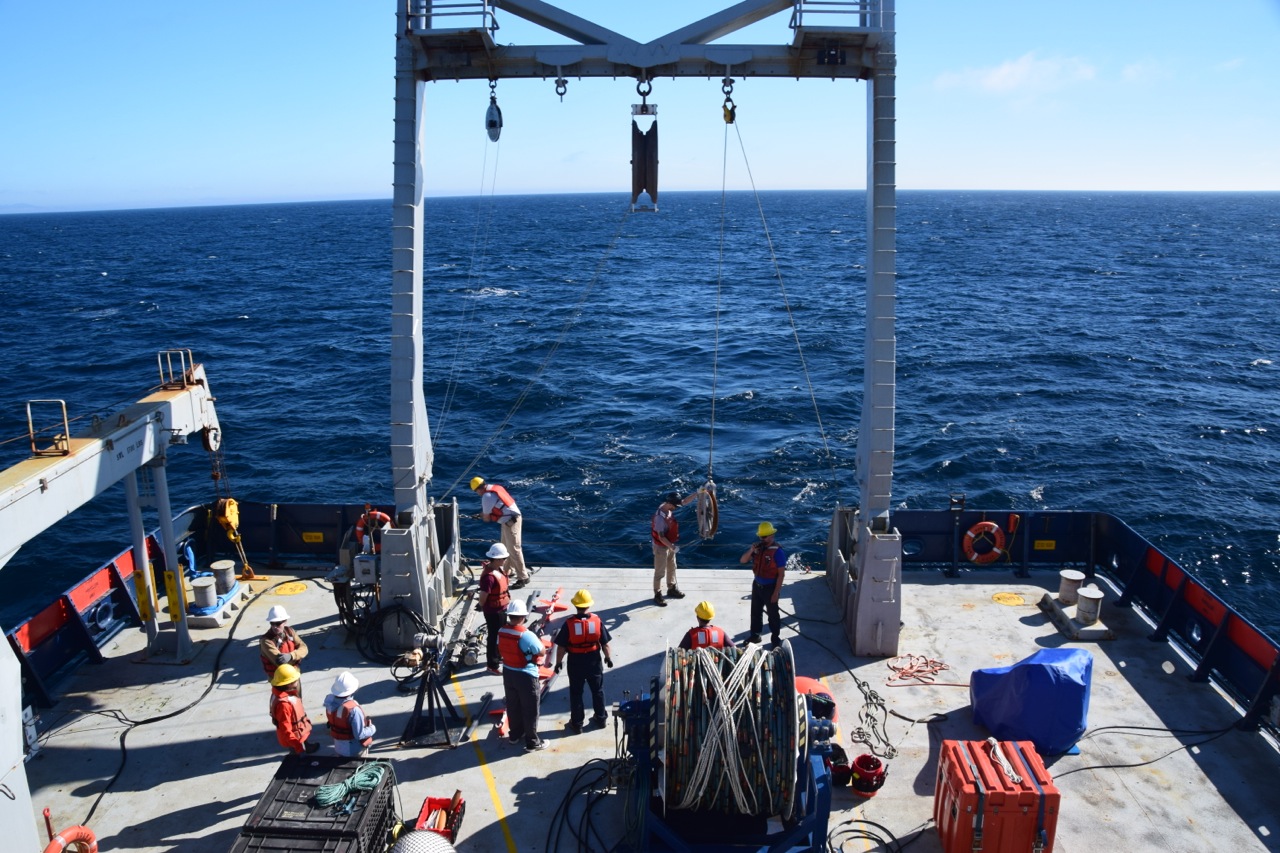
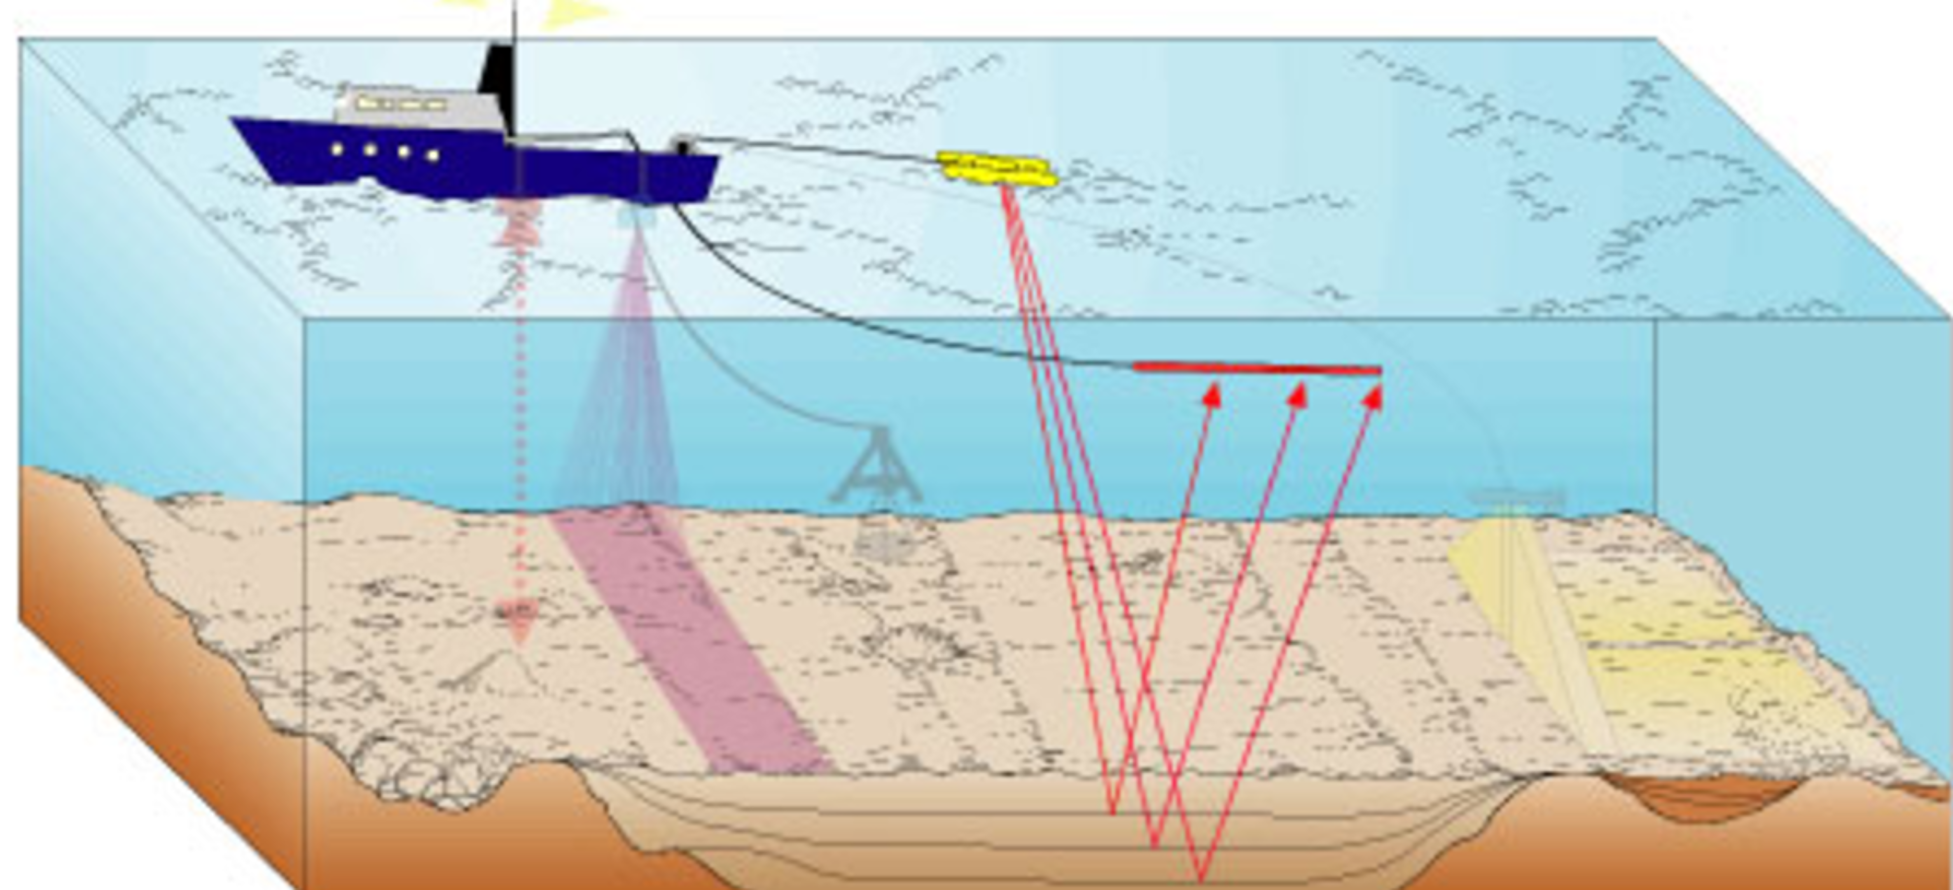
The technique employed to image the geology below the seafloor is called “seismic reflection profiling.” This process is comparable to the process of creating an ultrasound image. The research ship tows an acoustic source, in this case compressed air. The source releases and receives the compressed air (energy), and records the amount time it takes to reach the seafloor, layers below the seafloor, and return to the surface. We compile this data and create seismic images of the subsurface geology up to a few kilometers below the seafloor.

Diagram of a ship towing an acoustic source. Credit: USGS

My graduate school research involves studying and interpreting seismic images from Japan and Cascadia (the PNW) to understand how these plate boundaries evolve over time. Taking part in the acquisition and processing of this data has changed my entire perspective on my research, and my career. I’ve now been on deck to observe the acoustic source deployment process, I’ve logged and processed data, updated the track plan and communicated this information with the ship captain, and created daily maps and reports. I will eventually be able to use the data we collect for my own research project. It’s been an incredible experience making this science happen — like the art student who studies and interprets art, who then learns to paint and plan his or her own art installation for an exhibit.

Thank you to the National Science Foundation for making this expedition happen.

— Emily Schottenfels is a Ph.D. student at Boston University. Follow her on Twitter @emilyrschott, along with #SeismicECS


Exploring Earthquake and Tsunami Hazards Along the Pacific Northwest Coast

By Valerie Sahakian

Tsunamis can be dangerous and deadly. The 2011 Tohoku-Oki earthquake and tsunami occurred offshore Japan on March 10, 2011, killing over 15,900 people, injuring over 6,000, and leaving over 2,500 people missing. The magnitude 9.1 earthquake happened in a subduction zone – where one tectonic plate slides underneath another. The Washington, Oregon, and northern California coast is next to the Cascadia subduction zone, where the Juan de Fuca plate slides under the North American plate. Studies show that this region produced magnitude 9 earthquakes and ensuing tsunamis in the past. When it comes to these hazards in the Pacific Northwest (PNW), the question is not “if” we will get one, but “when” and what we can expect for earthquake and tsunami size. The best thing to do is to be prepared – and learn more about hazards in the PNW by studying the science of these phenomena.

Images from sms-tsunami-warning.org of the 2011 Tohoku-Oki tsunami in Japan. Tsunamis look more like fast-moving tides, not breaking waves.

Not all large earthquakes create tsunamis as big as the one in Tohoku. Can scientists determine how likely we are to have a tsunami along different parts of the PNW Coast and how big it would be? What types of things affect whether an earthquake is likely to cause a large tsunami? (Or none at all?)

On this expedition, we are collecting seismic data to answer these questions. The seismic data we acquire give us an image of what’s beneath the seafloor – like a vertical slice through it, from the seafloor down. We can use this image to look at the properties of the clay, or “sediment” beneath the seafloor, such as how thick it is, and where it is. Why does this matter for tsunamis? Tsunamis happen when the seafloor is moved abruptly – for example when an earthquake or an underwater landslide occurs. The more the seafloor moves, the larger a tsunami we expect.

Some earthquakes are contained much deeper in the earth, whereas others will break to the surface, in effect moving the seafloor. There is some evidence from Japan and Tohoku-Oki that the amount of sediment at the boundary between the two plates (the “incoming plate”, which is sinking, and the “overriding plate,” above it) may affect whether or not an earthquake breaks all the way to the surface. Scientists studying the Tohoku earthquake have found that the seafloor moved the most (in some places 50 meters – about 165 feet!!) in an area where there was thicker sediment between the two plates. With the seismic data we collect, we can map out where in Cascadia there is more sediment beneath the incoming plate and the overriding plate, and where the sediment is thinner. This map of sediment thickness can help us learn more about where larger tsunamis might be expected in Cascadia.

Cartoon 1 – Two sides of this cartoon show a cross-section, or slice of a subduction zone. One plate, the incoming plate, slides underneath another plate (the overriding plate). The area where these to plates meet, the “plate interface”, is where earthquakes happen (what the star marks). Some parts of subduction zones show a small amount of sediment from the ocean floor that sinks down with the incoming plate (on the left); others show a much thicker layer of sediments that subduct with the incoming plate (right).

It also seems that the type of clay in the sediment matters. Offshore Japan, scientists found a lot more of the type of clay called “smectite” in the sediments in the area where the Tohoku-Oki earthquake broke to the surface. There are some samples of sediment (“cores”) in this area, which show a variety of types of clay. We can collect seismic data over the location these cores were collected, and try to match up what we see in the seismic data with the different types of clay in the cores. In the future, with the seismic data we collect, we can also have targets of where to collect more cores to look for smectite.

Any findings from the seismic data we collect can help scientists who model earthquakes and tsunamis. If it is, in fact, more likely that some regions of the subduction zone could allow for earthquakes to break to the surface, what would the earthquake look like, and what would the ensuing tsunami look like? How high would it be, say, in Northern California vs. Central Oregon? How would this impact our schools, our hospitals, our homes? This information is crucial for understanding how to better prepare for tsunamis: How emergency responders should plan for events, how engineers and legislators can change our building codes and instate policies for disaster management, and how we can all protect ourselves from the natural hazards in our backyard.

— Valarie Sahakian is a postdoctoral researcher at USGS.

Planning to Get Underway

R/V Roger Revelle leaving Newport, Oregon on September 26. (All photos: Rebecca Fowler)

A typical research expedition has one or two chief scientists. Ours has 19. We chose this unconventional path so that, with support from the National Science Foundation, a large group of graduate students, postdoctoral researchers, and assistant professors would have the opportunity to gain valuable experience leading a research expedition and collecting marine seismic data.

Planning a research expedition is one of the most important tasks for a chief scientist — the person who’s responsible for the work that will take place during the expedition. Prior to meeting in Newport, the grad students and postdocs, or science party, worked remotely in groups of four to determine where in our set sampling region off the mid-Oregon coast, in an area of the Cascadia subduction zone, they’d collect their data.

This can be infinitely more complicated than it sounds. Members of a science party usually have diverse research objectives, meaning they want to collect different data from a variety of locations while at sea. Ship time is precious and expensive, so it’s not unusual for a research expedition to be made up of scientists pursuing different research projects within the same region. In our case, some members of the science party want to know about abrupt climate events of the past — events where there was rapid warming or cooling in the Pacific Northwest — others are interested in know more about the behavior of the slowly-shifting tectonic plates along the Oregon coast.

Brendan Reilly, Oregon State University, and John Schmeltz, Rutgers University, watch the deck operations.

Our science party did a phenomenal job of putting together a thorough science plan, especially given that they weren’t able to do this in person. The science party also achieved one of their other main tasks: Communicating their plan to everyone else involved in the expedition. The operator of the ship, the captain and crew, and the science technicians need this information prior to the expedition so they can plan and prepare everything that’s needed to accomplish the science mission.

Before starting our mission on the R/V Revelle, the entire science party gathered in Newport, Oregon and spent the better part of two days refining and revising their science plan — and ensuring that the captain and crew knew about the adjustments to it.

Revelle left the dock at 11 a.m. this morning, September 26. There have now been nearly 12 hours of constant learning and action. Instrument deployments, a safety briefing, a science meeting, two presentations by the scientists about their work, a couple of quick meals in the galley, and, for those who haven’t sailed before, the opportunity to find their sea legs.

Cruise participants getting their first taste of working on deck and deploying seismic instruments.

After nine months of planning, it’s exciting to see these young scientists in charge and working together to make this expedition happen. Their expedition training also includes experience communicating their research to non-scientists; on Monday I gave a three-hour workshop on science communication. In the coming week, you’ll hear directly from the science party — each member will write a post for this blog in the coming week.

And for the science-minded among you, you’ll also notice that we’ll post a daily science report with our most recent activities. See a few more photos from our day on the cruise Facebook page.

— Rebecca Fowler


Welcome!

This cruise is part of a 15-day training program designed to increase the number of early career scientists experienced in marine seismology.

A hands-on science communication workshop is part of this program. All participants will write a short blog post about their research. These posts will be shared on this blog during and after the cruise, along with daily scientific reports when we’re at sea.

Program participants include 19 early career scientists, two postdoc mentors, four research scientists, and one science writer.

We’ll gather in Newport, Oregon for a two-day pre-cruise workshop on September 24. Our research expedition begins on Tuesday, September 26 — please check back soon for updates on our work.