By Valerie Sahakian
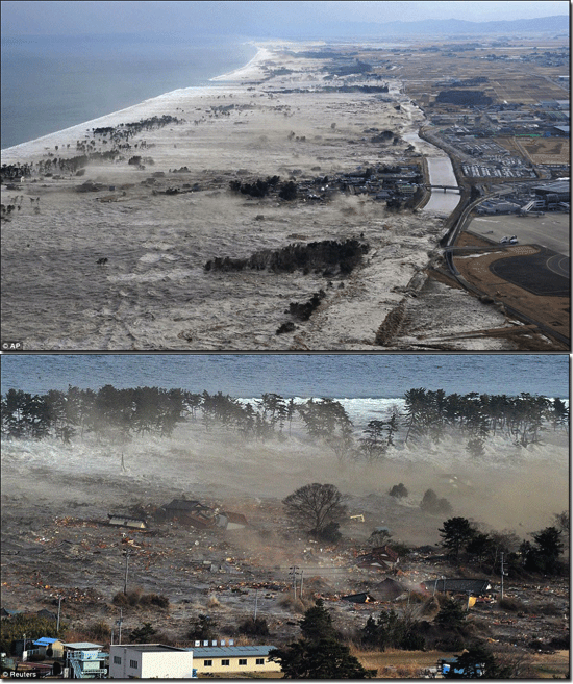
Tsunamis can be dangerous and deadly. The 2011 Tohoku-Oki earthquake and tsunami occurred offshore Japan on March 10, 2011, killing over 15,900 people, injuring over 6,000, and leaving over 2,500 people missing. The magnitude 9.1 earthquake happened in a subduction zone – where one tectonic plate slides underneath another. The Washington, Oregon, and northern California coast is next to the Cascadia subduction zone, where the Juan de Fuca plate slides under the North American plate. Studies show that this region produced magnitude 9 earthquakes and ensuing tsunamis in the past. When it comes to these hazards in the Pacific Northwest (PNW), the question is not “if” we will get one, but “when” and what we can expect for earthquake and tsunami size. The best thing to do is to be prepared – and learn more about hazards in the PNW by studying the science of these phenomena.
Not all large earthquakes create tsunamis as big as the one in Tohoku. Can scientists determine how likely we are to have a tsunami along different parts of the PNW Coast and how big it would be? What types of things affect whether an earthquake is likely to cause a large tsunami? (Or none at all?)
On this expedition, we are collecting seismic data to answer these questions. The seismic data we acquire give us an image of what’s beneath the seafloor – like a vertical slice through it, from the seafloor down. We can use this image to look at the properties of the clay, or “sediment” beneath the seafloor, such as how thick it is, and where it is. Why does this matter for tsunamis? Tsunamis happen when the seafloor is moved abruptly – for example when an earthquake or an underwater landslide occurs. The more the seafloor moves, the larger a tsunami we expect.
Some earthquakes are contained much deeper in the earth, whereas others will break to the surface, in effect moving the seafloor. There is some evidence from Japan and Tohoku-Oki that the amount of sediment at the boundary between the two plates (the “incoming plate”, which is sinking, and the “overriding plate,” above it) may affect whether or not an earthquake breaks all the way to the surface. Scientists studying the Tohoku earthquake have found that the seafloor moved the most (in some places 50 meters – about 165 feet!!) in an area where there was thicker sediment between the two plates. With the seismic data we collect, we can map out where in Cascadia there is more sediment beneath the incoming plate and the overriding plate, and where the sediment is thinner. This map of sediment thickness can help us learn more about where larger tsunamis might be expected in Cascadia.

It also seems that the type of clay in the sediment matters. Offshore Japan, scientists found a lot more of the type of clay called “smectite” in the sediments in the area where the Tohoku-Oki earthquake broke to the surface. There are some samples of sediment (“cores”) in this area, which show a variety of types of clay. We can collect seismic data over the location these cores were collected, and try to match up what we see in the seismic data with the different types of clay in the cores. In the future, with the seismic data we collect, we can also have targets of where to collect more cores to look for smectite.
Any findings from the seismic data we collect can help scientists who model earthquakes and tsunamis. If it is, in fact, more likely that some regions of the subduction zone could allow for earthquakes to break to the surface, what would the earthquake look like, and what would the ensuing tsunami look like? How high would it be, say, in Northern California vs. Central Oregon? How would this impact our schools, our hospitals, our homes? This information is crucial for understanding how to better prepare for tsunamis: How emergency responders should plan for events, how engineers and legislators can change our building codes and instate policies for disaster management, and how we can all protect ourselves from the natural hazards in our backyard.
— Valarie Sahakian is a postdoctoral researcher at USGS.