The Journey to the Heart of the Ocean

By Maureen Walczak

Mud, mud
Glorious mud
Nothing quite like it for cooling the blood
So follow me, follow
Down to the hollow
And there let us wallow in glorious mud.
— The Hippopotamus Song

Compared to the average grown-up, I spend an inordinate amount of time thinking about mud. In fact, I’m making a career out of it.

I am a research scientist who studies the history of Earth’s climate system. The ‘instrumental era,’ or period of time for which people have been making routine weather observations, only extends back to the mid-18th century. It wasn’t until after the mid-20th century, when world governments launched satellites with observational equipment and weather stations started proliferating across the continents, that scientists began developing a pretty good understanding of climate processes such as El Niño that occur every few years.

However, many features of our climate act on even larger, longer scales. Unfortunately, we can’t just turn on The Weather Channel to prepare for them. I solve this problem by turning to natural records of temperature, river discharge, and marine productivity left behind in ocean sediments. This means I have to understand not just the changes in biology and chemistry preserved in the sediments, but also how those sediments are transported and deposited on the seafloor; a complicated task in an energetic, earthquake-prone environment such as the marine margin of the Pacific Northwest.

Ocean sediments can be made of a wide variety of stuff. Some parts are organic: the remains of marine creatures, most of them tiny, that died and sank to a watery grave along with stories about the world they knew. But most marine sediments located within several hundred kilometers of a continent are comprised of eroded rock, carried to the ocean by rivers and delivered to the deep sea by waves and currents. This voyage is shaped by many different factors, but the two most important variables are: (1) the size of the sediment and (2) the speed of water flow.

Essentially, the journey comes down to how hard a particle is to move, and how much energy there is to move it. The interplay of these factors broadly results in the concentration of coarse sediments, such as cobbles and pebbles, in energetic environments like beaches and rivers, while finer sediments are swept into progressively deeper water by progressively weaker currents until, finally, even the smallest grains settle quietly into the deep.

Schematic illustrating the major features of a continental margin. Image: Encyclopaedia Brittannica

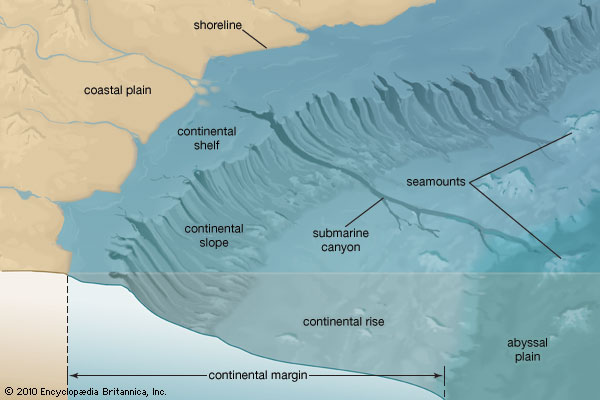
In spite of the general truth of this process, some coarse sediment does make its way from the shoreline far into the ocean, flowing across the shelf and down the continental slope following submarine channels and canyons. The intermittent movement of these underwater rivers of sediment is typically initiated externally (perhaps by a large storm or earthquake), but once the flow has begun it becomes self-exciting, which is to say the fluid slurry of sediment in a channel becomes denser than the surrounding water and is propelled down-slope by gravity, eroding and entraining more material on its journey to the abyssal plain. These flows are called turbidity currents, and the resulting deposits of coarse sediment, termed turbidites, can extend hundreds of kilometers into the ocean; watch the video below and you’ll see a small turbidite occur.

Turbidite deposits also have a tale to tell: for example, they have been used to infer the timing and frequency of major earthquakes in the Pacific Northwest. However, because they aggressively change the seafloor, they can destroy some information about the past by mixing together sediment deposited at different times while eroding other periods of time away entirely. For the kind of high-resolution reconstruction of past climate that I specialize in, turbidites typically spell trouble. And because the Washington/Oregon margin is famously tectonically active, incised by large submarine canyons and frequented by submarine landslides, few such reconstructions exist for this region of the world.

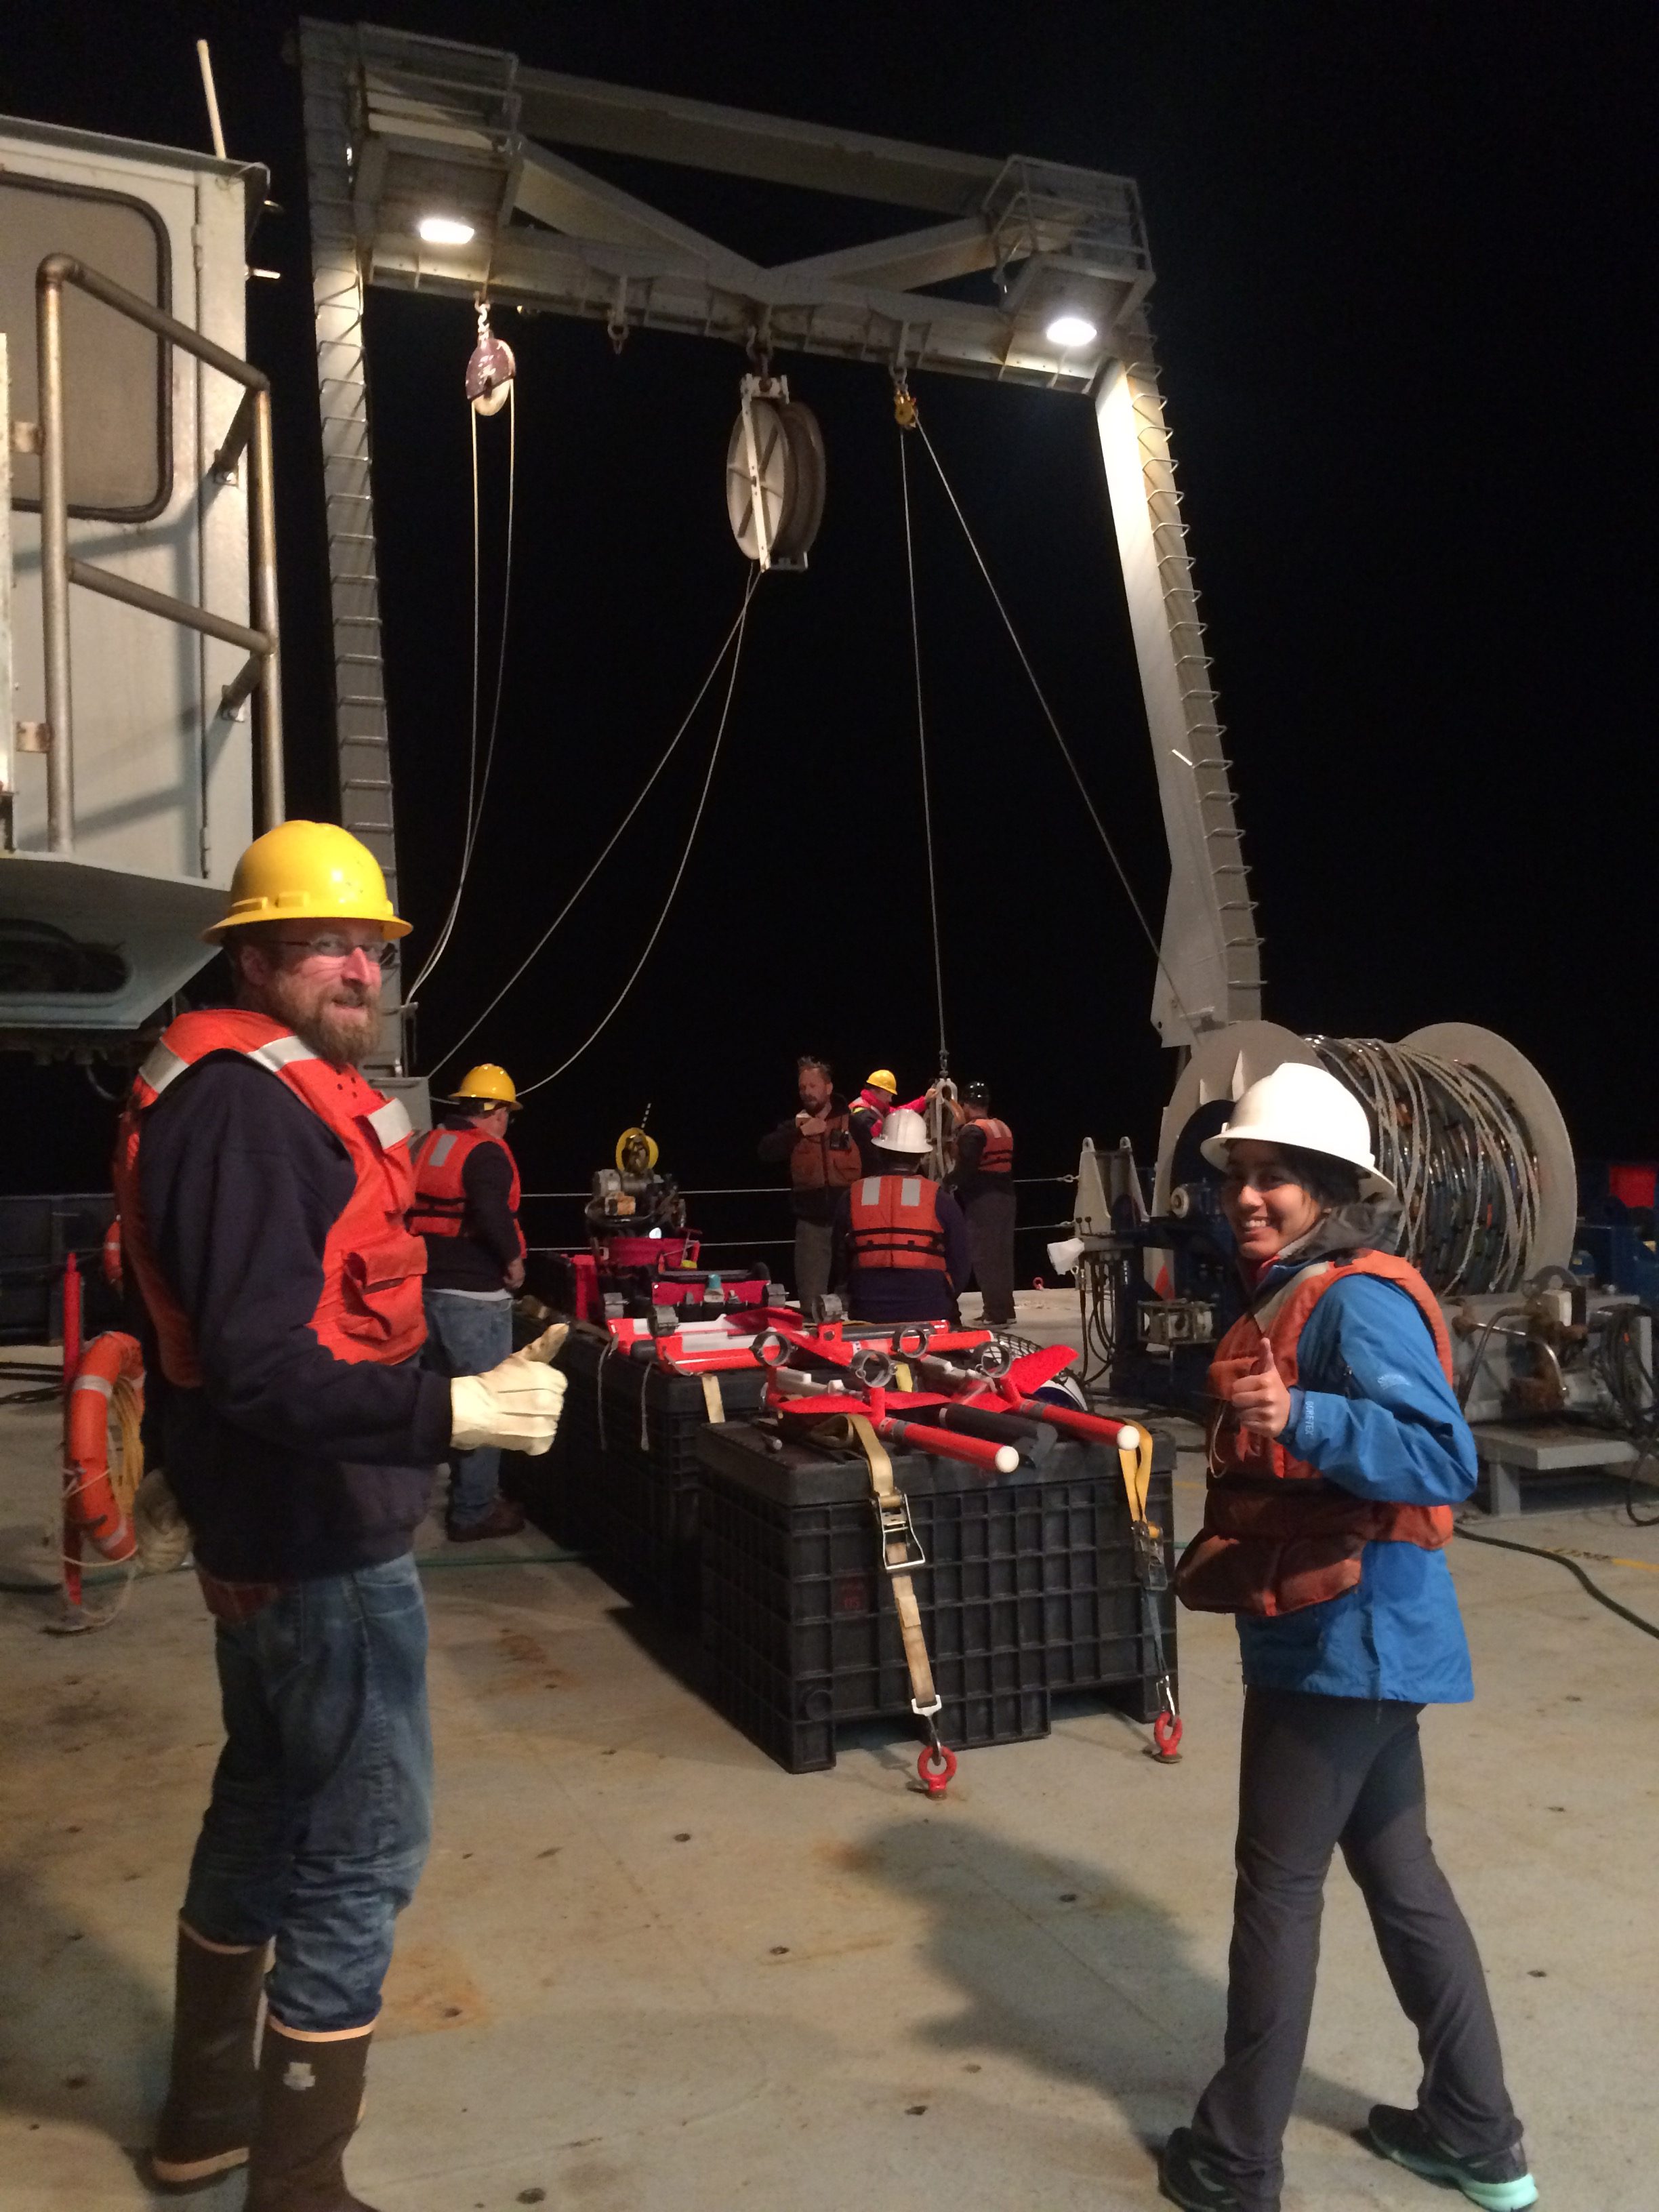
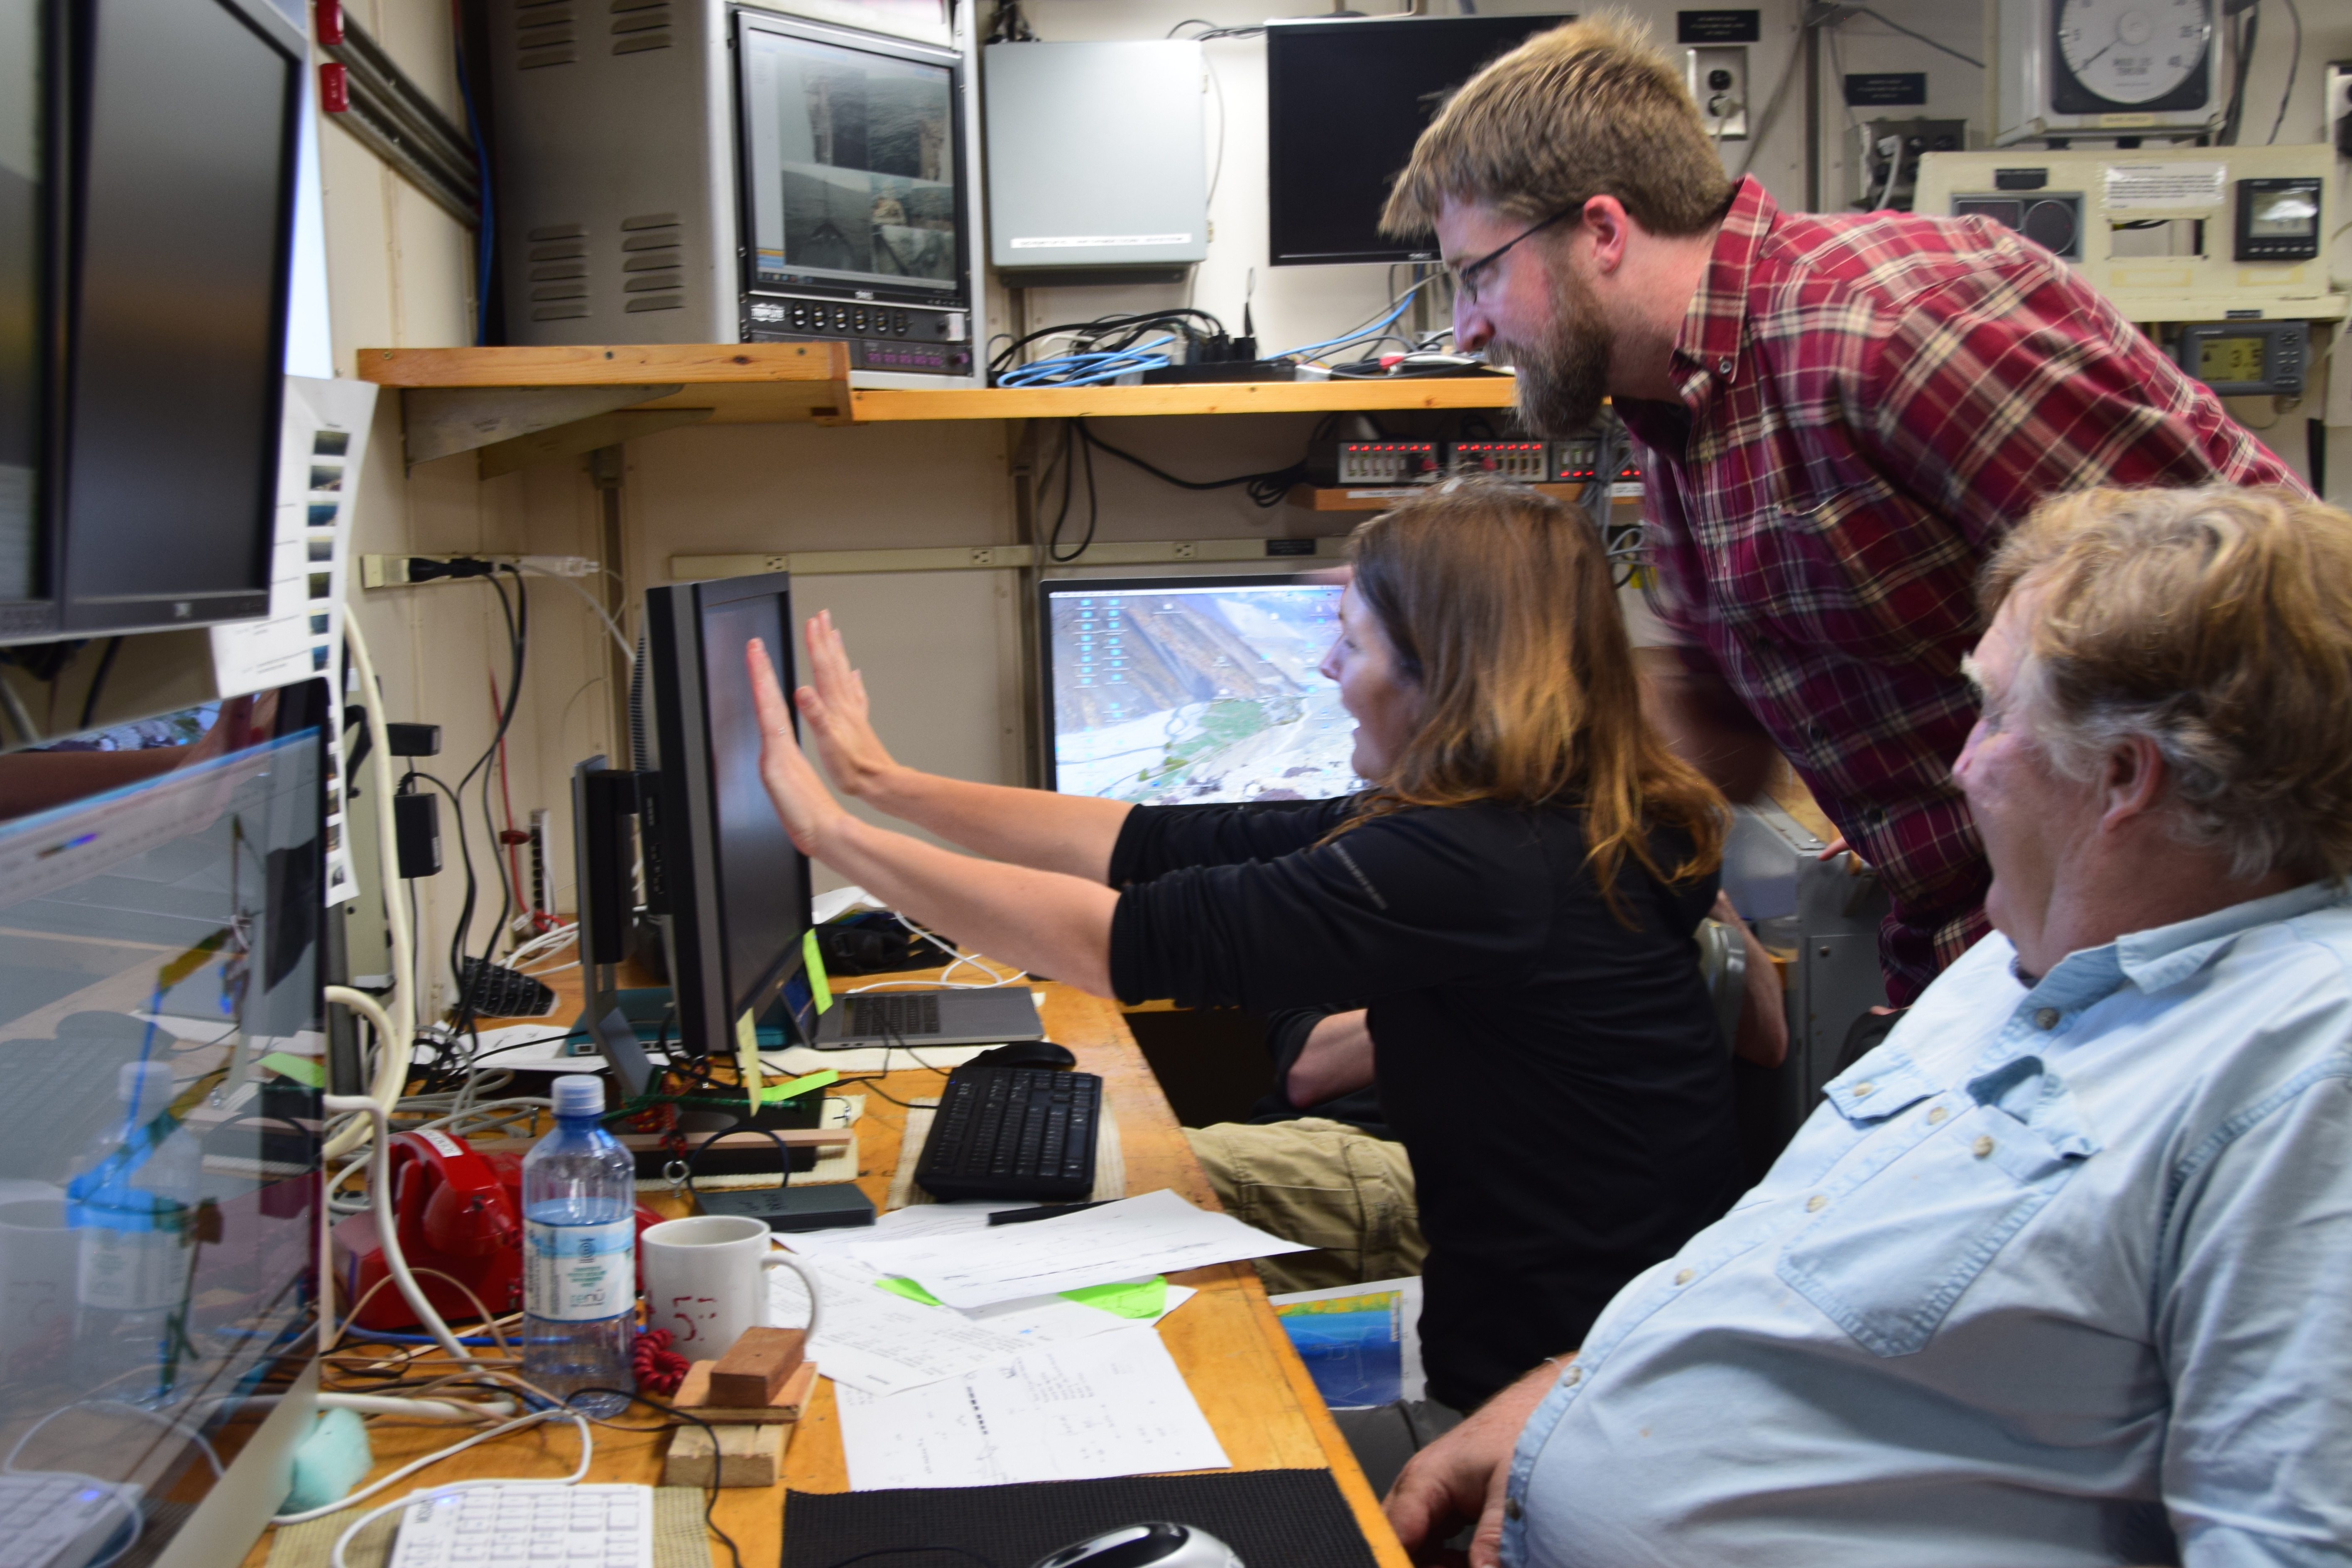
In spite of the difficulty of the task, we are now endeavoring to fill this gap in our knowledge of the climate history of the Pacific Northwest. Working with other experienced scientists at Oregon State University, fellow Early Career Scientist (ECS) Training Cruise participant Brendan Reilly and I carefully selected coring sites on the continental slope adjacent to the Columbia River that might contain records of past climate undisturbed by turbidity flows. As ECS project PI and professor Mitch Lyle put it, we “thought like a sediment particle,” tracing the channels and canyons of the slope on detailed maps of the seafloor while imagining where we might find quiet backwaters with continuous, undisturbed deposits.

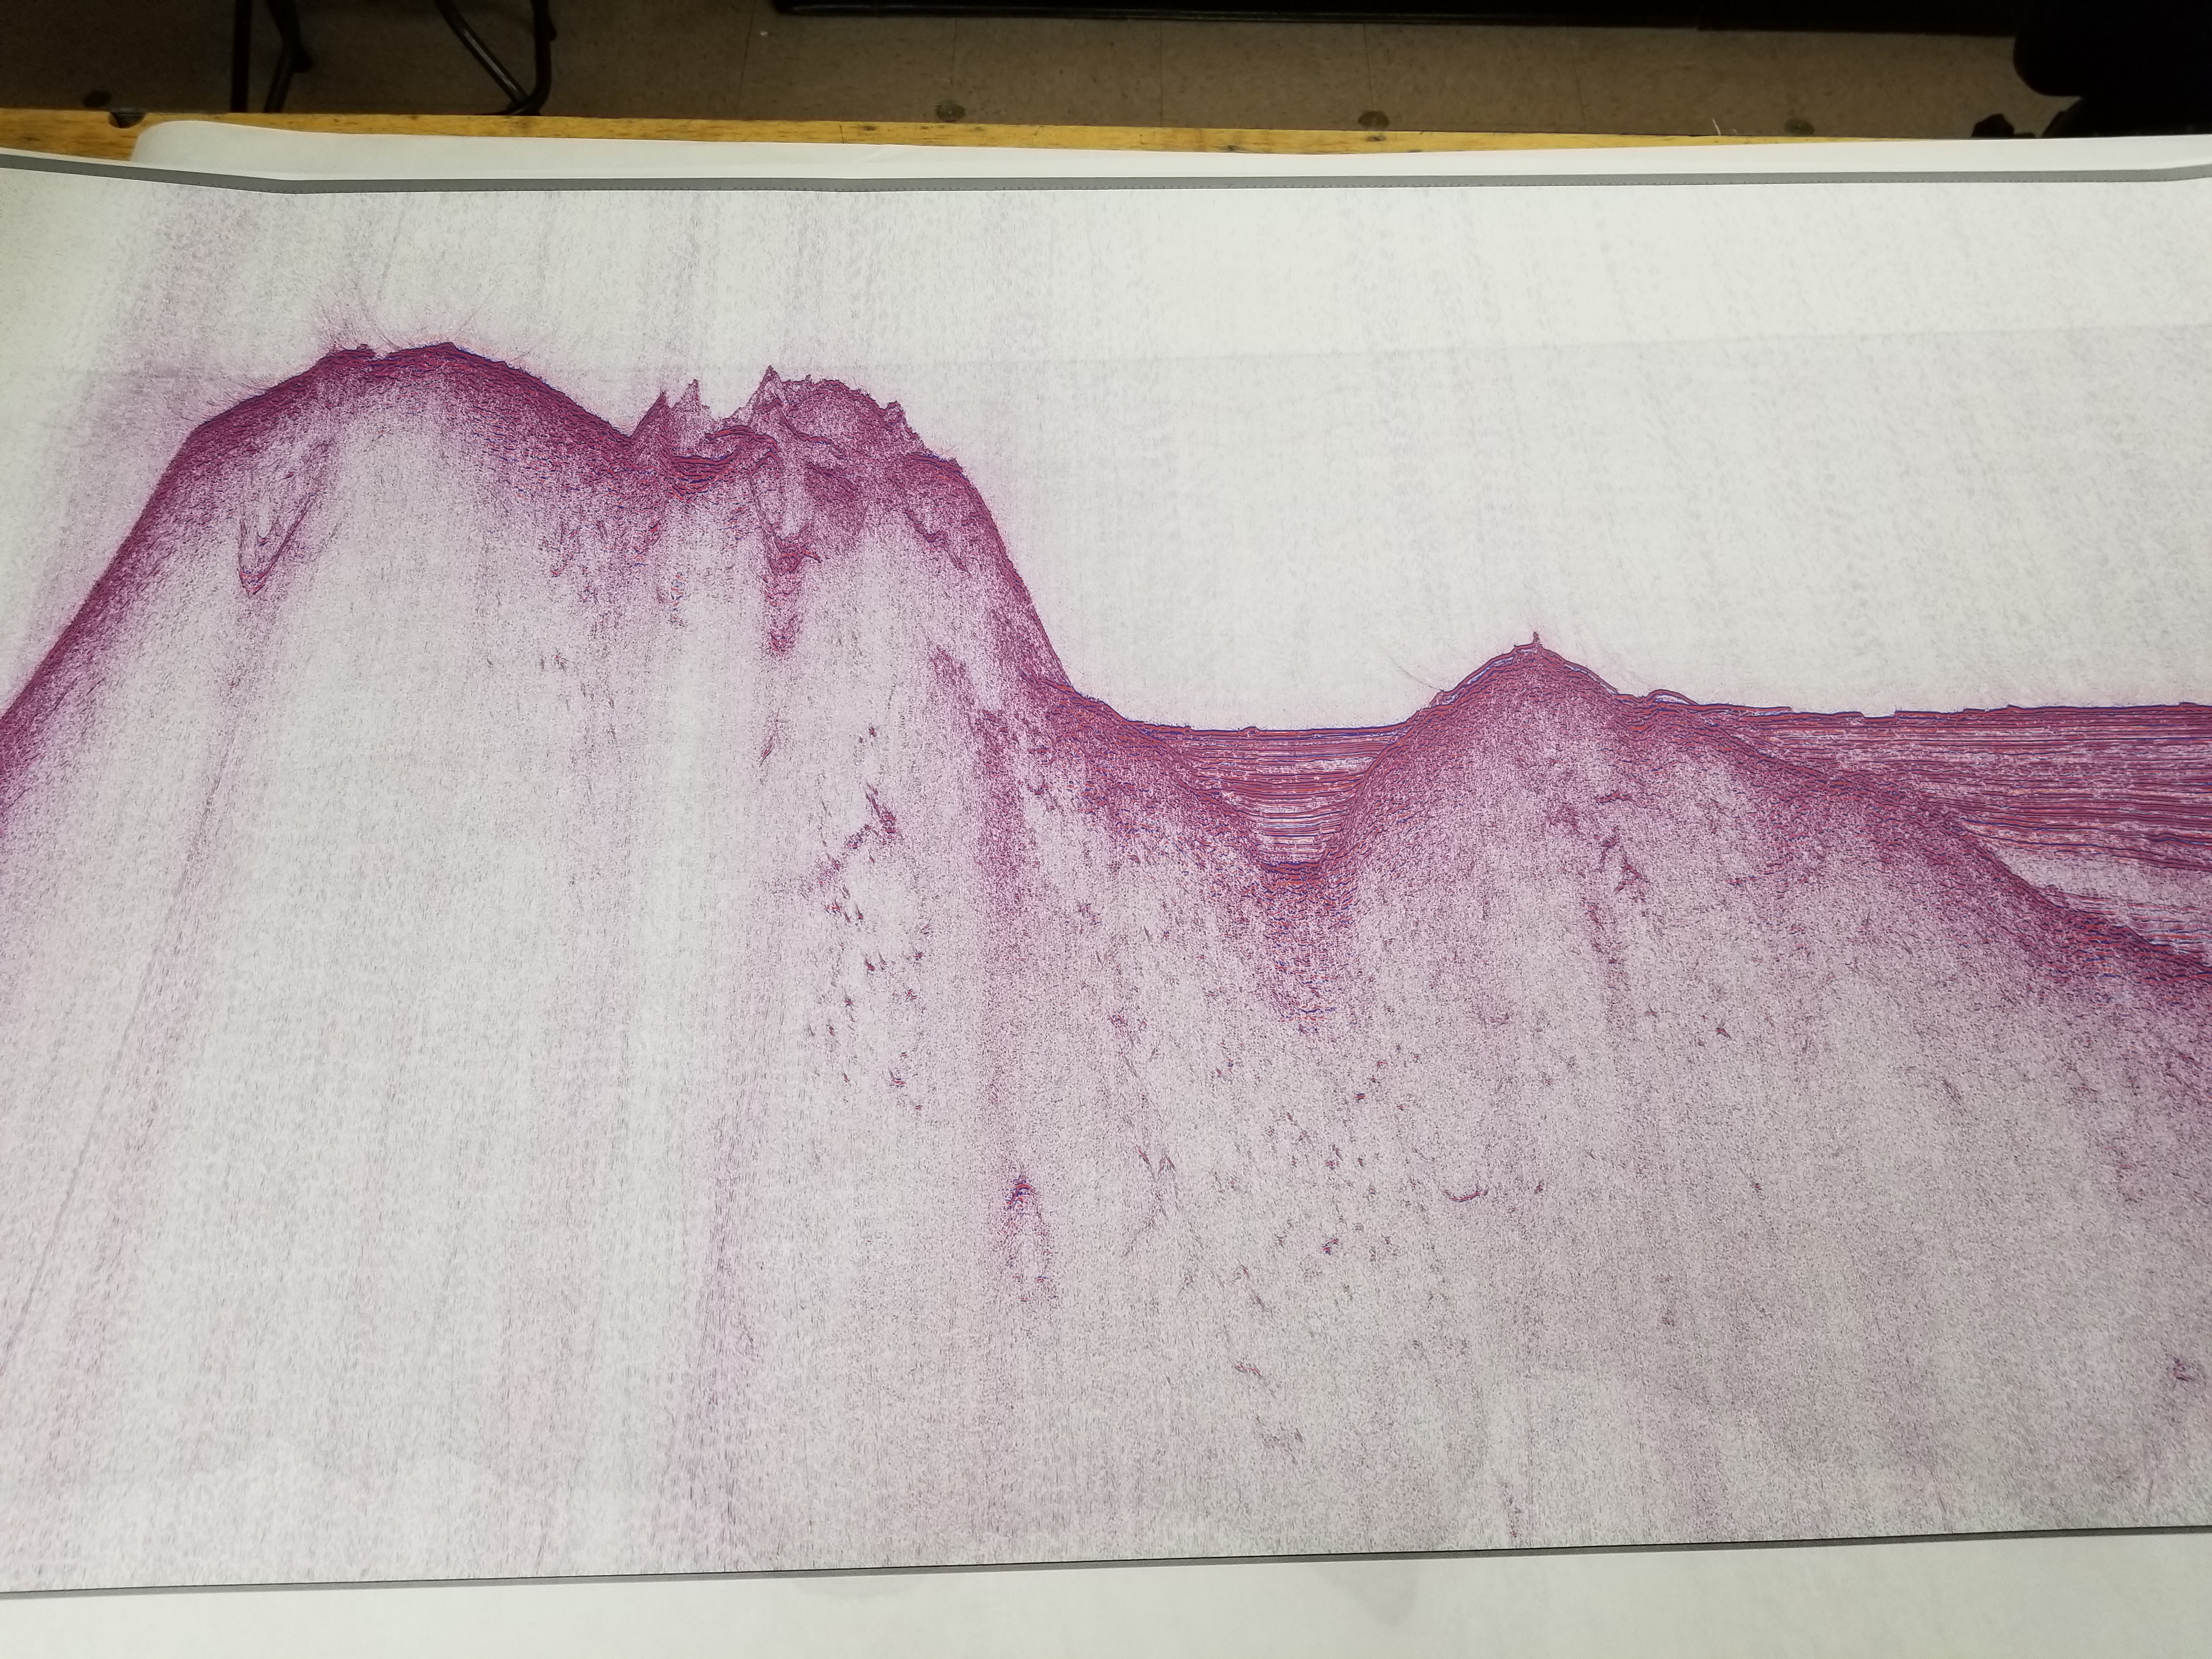
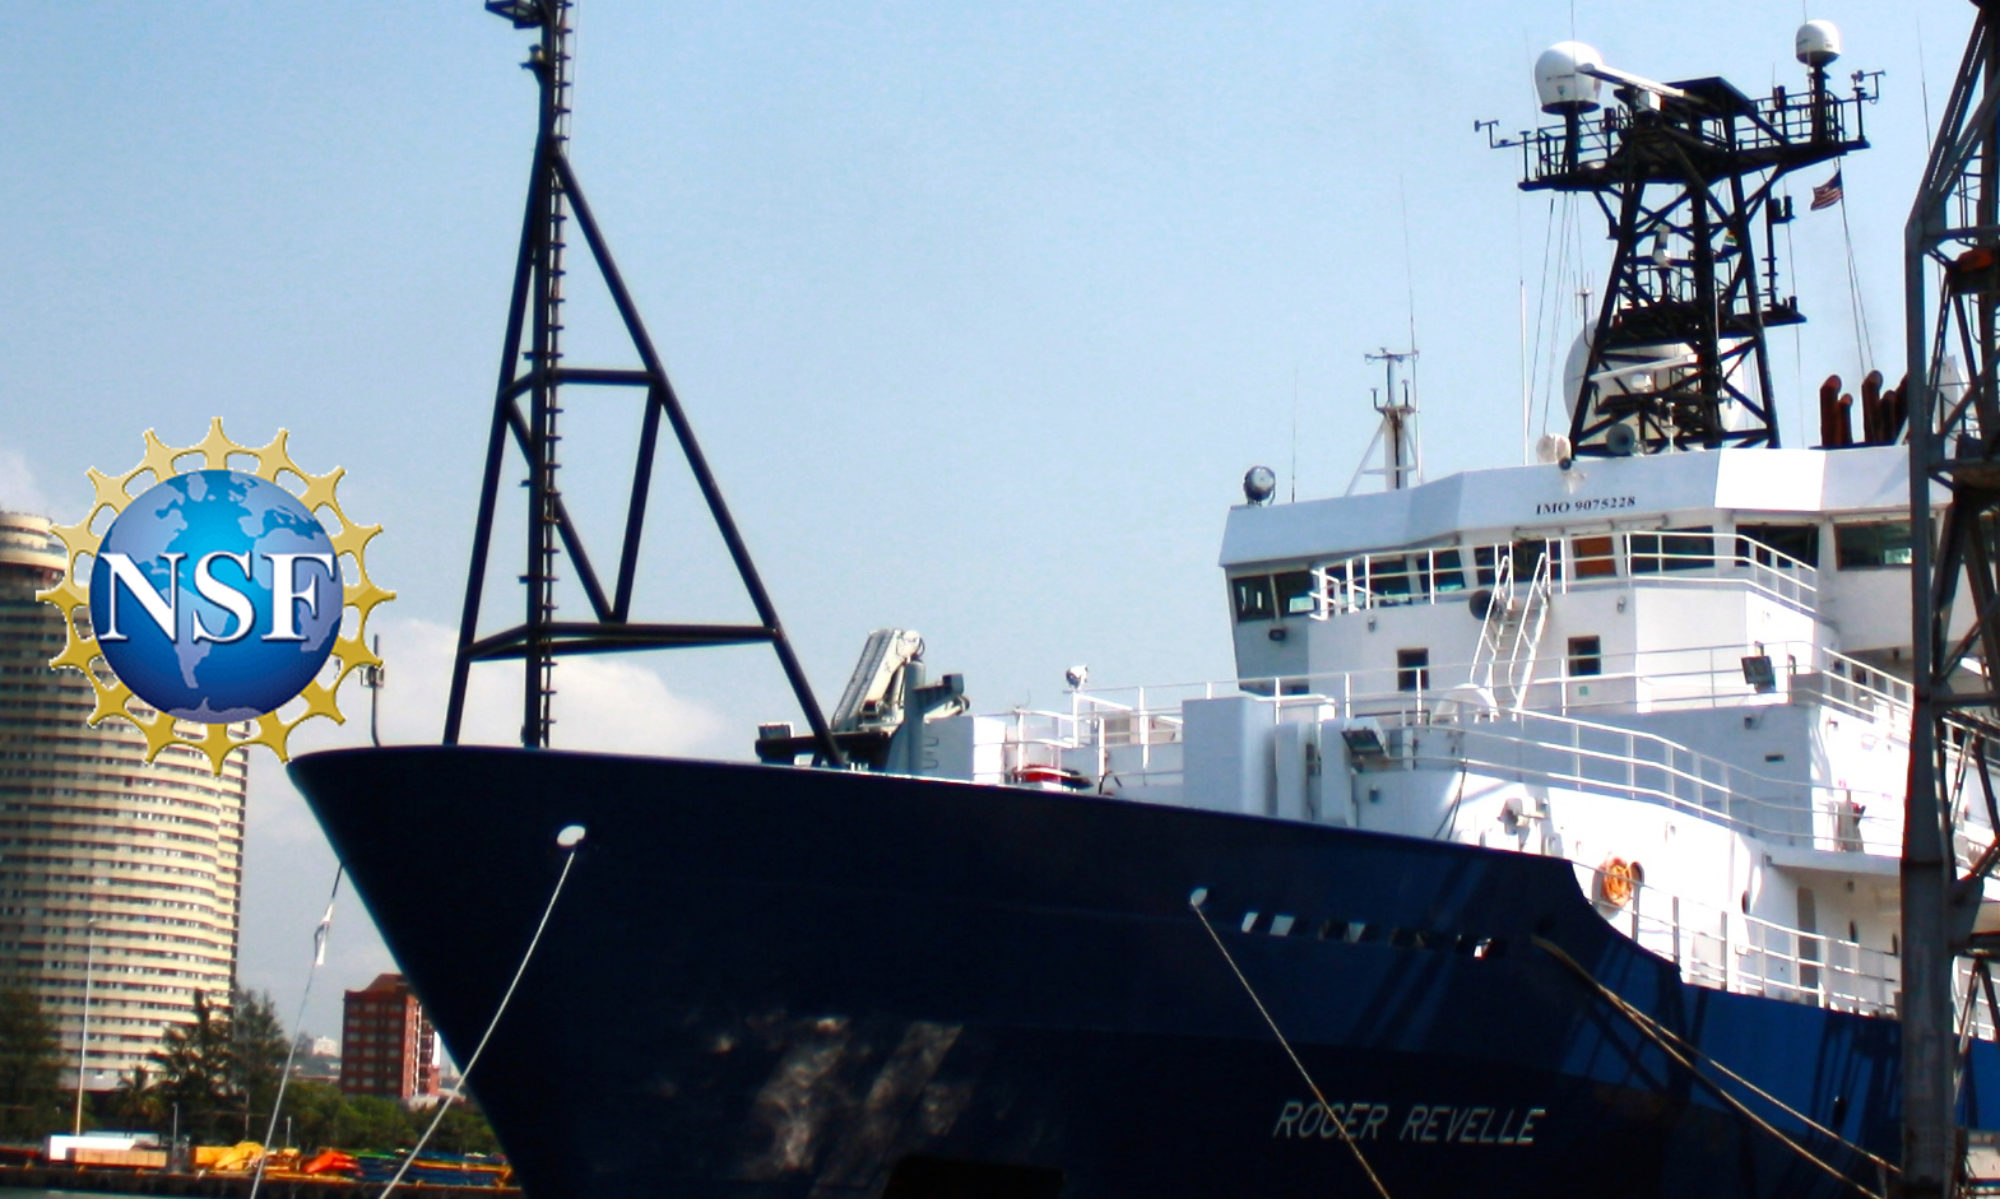
We visited and successfully collected sediment cores from our favorite sites in June 2017 from the R/V Oceanus, state-funded cruise OC1706B, and will use these records to reconstruct the climate history of the margin back to the end of the last ice age ~20,000 years ago. During the National Science Foundation-funded ECS on the R/V Revelle, RR1718, we collected deeper images of these thick sediment layers, identifying ideal places to recover even longer records that could extend our understanding of climate variability on the margin back hundreds of thousands of years. To say we’re excited is an understatement.

ECS expedition participants Maureen Walczak, Brendan Reilly, and Mitch Lyle enjoying some great data. Photo: Rebecca Fowler

Because instrumental records of regional climate are so short, policy makers are at present ill-equipped to make management decisions that encompass the range of possible environmental conditions in coming decades and centuries. The Columbia River currently supports 14 hydroelectric dams, producing close to half of the hydropower available to the entire United States. The river also supports many hundreds of thousands of acres under agriculture in the arid eastern parts of Washington and Oregon and a salmon fishery with an annual value of over 100 million dollars. As the population in this region grows, with seven million people and counting living in the drainage basin of the Columbia, the pressure on climate-sensitive natural resources such as water is only expected to increase. Fortunately, the progress we are making in identifying long-term natural repositories of regional climate history will help us responsibly prepare for the future.

So the next time you stand on the seashore, wiggling your toes in the sand and staring at the waves, perhaps spare a thought for the sediment particles bumbling their way into the deep with their secrets. I certainly do.

— Maureen Walczak is a postdoc at Oregon State University


Understanding Submarine Landslides

By Alexis Wright

Most people have seen the damage landslides can cause in areas of steeply dipping terrain, but are probably less familiar with what happens when landslides occur underwater. These events, known as submarine landslides, rapidly move large volumes of sand and mud down sea slopes, causing water to rush to fill the eroded space. This sudden movement can create a tsunami at the sea surface that poses a hazard to nearby coasts and the people who live on them. Offshore, the sliding sediment can directly damage infrastructure on the ocean bottom like cables, pipelines, or drilling platforms.

To mitigate these potential hazards, we need to be able to predict where and when and to what extent submarine landslides will occur. My research aims to answer these questions by investigating the ground beneath a landslide. I then interpret what processes, like faulting or folding of the subsurface, pressurized fluids trapped in buried pore spaces, or loosely packed sediments along steep gradients, lead to instability of a given underwater slope. With an understanding of how these factors contribute to destabilizing the seafloor, I can look for similar patterns beneath intact slopes to identify where future failures may occur.

Night operations on the R/V Revelle. Chief scientists in-training Brendan Reilly and Estefania Ortiz oversee deployment of the Scripps portable seismic system. Photo: Alexis Wright

None of this work is possible without data. But how do myself and other scientists study a process that happens under hundreds of meters of water? We rely on seismic reflection data, which uses acoustic sources towed behind a research ship to produce sound waves that travel into the ground and get reflected back by layers in the subsurface. The reflected waves are recorded by a cable containing hydrophones (underwater microphones) towed behind the sound sources, which enable us to generate an image of the geology beneath the seafloor.

I am currently aboard the R/V Roger Revelle, a ship belonging to the University-National Oceanographic Laboratory System (UNOLS) academic research fleet, to collect these data. My research target is a submarine landslide off the coast of Oregon, called the Heceta landslide; I want to find out why and how this large submarine landslide has occurred. On this National Science Foundation-funded Early Career Seismic Chief Scientist Training expedition, 19 principal investigators (PIs) have taken their studies out to sea for a week of 24-hour operations.

No matter the advance preparations taken by everyone onboard, the seas always present new challenges. For example, collecting data requires the use of delicate electrical equipment, something that does not pair well with harsh conditions and corrosive salt water, which makes equipment malfunctions not uncommon. This expedition was no exception: We ran into problems with one of the acoustic sources not functioning properly, leaving us to troubleshoot the issue at sea so we could resume collecting data. Minor setbacks like these are expected and the science team has planned accordingly and come up with alternate data acquisition plans to maximize our time on the Revelle. Thanks to the hard work of the ship’s crew, operations were quickly up and running again!

At the end of this valuable training opportunity, I will return to land with data for my current studies. My experience in leading, adjusting ship plans, and processing incoming data gained during this expedition has made me feel that the process of collecting data at sea is much accessible than before. Motivated by the data collected on this expedition and the understanding of what goes into developing a field program, collaborative efforts between participants with complimentary research targets are beginning to evolve. Thanks to funding from the National Science Foundation and the availability of the UNOLS academic research fleet, up and coming scientists — like myself — have gained real-world professional training at sea alongside seasoned researchers and can carry on the future of marine geophysical research.

— Alexis Wright is a graduate student at USGS/Colorado School of Mines

Learning Seismic Data Acquisition in Seven Days

By Subbarao Yelisetti

In the last ten years, earthquakes around the Pacific Ocean have caused a lot of damage and destruction in places like New Zealand, Japan, and Chile. These ring alarm bells for people living on the west coast of the U.S. and Canada, which is also due for a large earthquake. The Cascadia Subduction Zone, where the Pacific plate slides beneath the North American plate, runs from southern British Columbia to northern California. The last major earthquake on the Cascadia margin occurred in January 1700. The plates are currently locked —not sliding — and the stress has been building up since then, with occasional small earthquakes releasing some of this stress. In general, the interval between major earthquakes is about 300-700 years. We are currently in that time period, which means another large earthquake could occur anytime. The longer it takes, the bigger the earthquake could be, because there’s more time for the stress build up.

When a major earthquake occurs, it can trigger massive landslides and subsequent tsunami, and the one in the northwest U.S. is expected to cause greater damage to coastal populations and infrastructure; most of the current building codes on the west coast are not capable of withstanding a major earthquake. This situation requires scientists to investigate more data and look into evidence to better understand where the faults are located in the subsurface, their orientation, and exactly how the stress is building up. The best way to get this information is through marine seismic studies, as they are the least expensive and provide more accurate information compared to other geophysical methods such as gravity and magnetics surveys or drilling into the seafloor. Plus, the existing land-based seismic studies are not enough to understand what is going on offshore. We need more marine studies to better understand the subsurface structure offshore.

As part of our seven-day Early Career Scientist Seismic Training Cruise on the R/V Revelle, we are collecting seismic data by creating acoustic sound pressure waves that travel through the water and beneath the seafloor. We then record the reflected wave energy using hydrophones towed in the water column behind the ship. The recorded data is processed to create the subsurface image. This is similar to taking an image of the body by passing x-rays through it.

These images show faults beneath the subsurface, fluid seeps, and underwater mountains, which give us clue about subsurface dynamics along the Cascadia Subduction Zone, which is critical to understand natural hazards on the West Coast. Therefore, this research expedition has great societal significance apart from training the early career scientists — and more such cruises will benefit the society immensely.

— Subbarao Yelisetti is an Assistant Professor of Geophysics at Texas A&M University-Kingsville

Daily Cruise Report | Day 275

Daily Summary: R/V Roger Revelle continued collecting multichannel seismic (MCS) data on Line 20. At 00:07 UTC the multibeam and chirp systems were synced to ping simultaneously in an attempt to clean up the response from the multibeam data. A possible seep was spotted on the multibeam at 02:21 UTC. The multibeam continued to have issues, and power cycled at 02:30 UTC. Meanwhile, XBT 8 was dropped at 02:14 UTC. The end of Line 23, the last survey line, was reached at 12:02 UTC and the GI sound source was turned off and the sound source and streamer were recovered on deck. The multibeam and chirp systems were turned off at 14:24 UTC. The R/V Revelle arrived at the dock in Newport, Oregon around 12:00 Pacific Time, marking the end of the expedition.

— Ashley Long, Coastal Carolina University

Agua, Hielo y Fuego desde las Profundidades de Cascadia

Por Casey Hearn

Aquí está un acertijo para usted: Es blanco como la nieve, frío al tacto, y se derrite en la palma de su mano, pero acercalle un cerillo y verlo arder! No lo encontrarás en la cima de una montaña o descansando en un glaciar, sino que hará su hogar en el barro bajo el mar. ¿Qué en la tierra podría ser?

Nuestra sustancia misteriosa se conoce como hidrato de metano, o clatrato, y se forma en los sedimentos del fondo marino en los márgenes continentales de todo el mundo. Durante millones de años, los restos de minúsculas plantas y animales marinos cubren el fondo marino en capas de lodo orgánico que puede estar a miles de kilómetros de profundidad. Este material se descompone lentamente, ya sea por el metabolismo de los microbios o por la combinación de la intensa presión del peso del sedimento y el agua por encima y el calentamiento desde el interior de la tierra por debajo. Se producen grandes cantidades de gas metano por esta descomposición, y las burbujas flotantes se filtran hacia arriba a través del sedimento hacia el fondo marino.

Entonces una cosa extraña sucede a algo del gas. En ciertos lugares justo debajo del lecho marino, donde las condiciones de temperatura y presión son las correctas, moléculas de gas metano quedan atrapadas en una jaula de moléculas de agua para formar un sólido que se parece al agua-hielo. Las grandes acumulaciones de esta sustancia, conocidas como hidratos de metano, llenan los pequeños espacios de poros entre los granos de sedimentos del fondo marino para crear grandes depósitos de hasta 500 metros de grueso. Por debajo de la capa de hidrato, las burbujas libres que se mueven hacia arriba quedan atrapadas y forman bolsas de gas. Como resultado, a través de los muchos márgenes costeros de los océanos del mundo, vastas reservas de gas metano son congeladas y encerradas bajo el fondo marino.

El proceso natural de formación de gas e hidratos ha estado en curso durante muchos millones de años, pero los depósitos pueden ser inestables. Debido a la estrecha gama de condiciones bajo las cuales se forman, pequeños cambios de temperatura o presión pueden causar inestabilidades, derretir los hidratos y liberar el gas. La mayor parte del gas liberado se produce naturalmente en penachos de pequeñas burbujas que se disuelven rápidamente en el agua de mar a medida que suben hacia la superficie. Pero si el gas se libera en grandes cantidades, se desahogará y se elevará demasiado vigorosamente para ser disuelto, rompiéndose en la superficie del mar para entrar en la atmósfera.

En la atmósfera, el metano actúa como un gas de efecto invernadero extremadamente potente, 80 veces más eficaz que el dióxido de carbono para atrapar el calor del sol durante sus primeros 20 años. Una gran liberación de gas metano a la atmósfera podría elevar rápidamente la temperatura atmosférica global y transferir más calor a los océanos. Debido a la sensibilidad de los hidratos a los cambios en la temperatura del agua, este calentamiento activaría la liberación de más metano en un ciclo denominado bucle de retroalimentación positiva. Con el fin de hacer predicciones más precisas de la magnitud del cambio climático mundial esperado, científicos necesitan saber cuánto metano se almacena en los sedimentos oceánicos como hidrato y qué depósitos son vulnerables a los rápidos aumentos de la temperatura del agua.

En nuestra expedición frente a la costa de Oregón, nos propusimos ayudar a responder a esta pregunta complementando el inventario de depósitos conocidos de hidratos de metano. ¿Recuerdan los bolsillos de gas atrapado que se forman debajo de los depósitos de hidrato en los sedimentos oceánicos? Cuando un pulso de sonido que viaja a través del sedimento cruza este límite, su velocidad cambia repentinamente y una gran cantidad de energía rebota de regresso. Los hidrófonos que remolcamos detrás de nuestro barco reciben esta energía sonora reflejada y la registran digitalmente; cuando se procesan estos datos se genera una imagen del submarino y se destacan claramente las bolsas de gas.

He estado atento a estas transiciones del hidrato / gas, que llamamos Reflectores de Simulación de Fondo, durante mi tiempo a bordo y estoy feliz de reportar que hemos identificado bastantes nuevos. Esta expedición ha sido una experiencia fenomenal para mí: mejorando no sólo mis habilidades como investigador, sino también aprendiendo a planificar y dirigir eficazmente. Mientras el trabajo puede ser difícil y los días son largos, el paisaje y la compañía no puede ser vencido. Mi tiempo en el mar siempre se me acaba muy rapido. Realmente me encanta estar aquí.

— Casey Hearn es un estudiante de doctorado en el University of Rhode Island (traducción por Fani Ortiz)


Water, Ice, and Fire from the Depths of Cascadia

By Casey Hearn

Here’s a riddle for you: It’s white as snow, cold to the touch, and melts in the palm of your hand, but put a match to it and watch it burn! You won’t find it on a mountaintop or resting on a glacier, it makes its home in the mud beneath the sea. What on earth could it be?

Our mystery substance is known as methane hydrate, or clathrate, and it forms in seafloor sediments on continental margins all over the world. Over millions of years, the remains of tiny ocean plants and animals cover the seafloor in layers of organic-rich mud that can be miles deep. This material slowly decomposes, either by the metabolism of microbes or by the combination of intense pressure from the weight of sediment and water above and heating from the earth’s interior below. Large amounts of methane gas are produced by this decomposition, and the buoyant bubbles percolate upwards through the sediment towards the seafloor.

Then an odd thing happens to some of the gas. In certain places just below the seafloor, where the temperature and pressure conditions are just right, molecules of methane gas become trapped in a cage of water molecules to form a solid that resembles water-ice. Large accumulations of this substance, known as methane hydrate, fill up the tiny pore spaces between grains of seafloor sediment to create large deposits up to 500 meters thick. Below the hydrate layer, free bubbles moving upwards become trapped and form pockets of gas. As a result, across the many coastal margins of the world’s oceans, vast stores of methane gas are frozen and locked away beneath the seafloor.

The natural process of gas and hydrate formation has been ongoing for many millions of years, but the deposits can be unstable. Due to the narrow range of conditions under which they form, small changes in temperature or pressure can cause instabilities, melting the hydrates and freeing the gas. Most of the gas released naturally occurs in plumes of small bubbles which quickly dissolve into the seawater as they rise towards the surface. But if the gas is released in large quantities, it will vent and rise too vigorously to be dissolved, breaking free at the sea surface to enter the atmosphere.

In the atmosphere, methane acts as an extremely potent greenhouse gas, 80 times more effective than carbon dioxide at trapping heat from the sun during its first 20 years. A large release of methane gas to the atmosphere could quickly raise global atmospheric temperatures and transfer more heat to the oceans. Due to the sensitivity of hydrates to changes in water temperature, this warming would trigger the release of even more methane in a cycle termed a positive feedback loop. In order to make more accurate predictions of the extent of expected global climate change, scientists need to know how much methane is stored in ocean sediments as hydrate and which deposits are vulnerable to rapid increases in water temperature.

On our expedition off the coast of Oregon, we set out to help answer this question by supplementing the inventory of known methane hydrate deposits. Remember the pockets of trapped gas that form below hydrate deposits in ocean sediments? When a pulse of sound traveling through the sediment crosses this boundary its speed changes suddenly and a large amount of energy bounces back. The hydrophones we tow behind our ship receive this reflected sound energy and record it digitally; when this data is processed an image of the sub-seafloor is generated, and the pockets of gas stand out clearly.

I’ve been on the lookout for these hydrate/gas transitions, which we call Bottom Simulating Reflectors, during my time on board and I’m happy to report that we’ve identified quite a few new ones. This expedition has been a phenomenal experience for me: improving not only my abilities as a researcher but also learning how to plan and lead effectively. While the work can be hard and the days are long, the scenery and company can’t be beat. My time at sea always rushes by in a blur. I really love it out here.

— Casey Hearn is a Ph.D. student at the University of Rhode Island

I Got 99 Problems, but Understanding How to Acquire Seismic Data Ain’t One

By Kittipong Somchat

I have been using seismic data for the past five years of my graduate study, but I’d never before had the experience of collecting these data. All of the seismic data I have worked on are downloaded and ready in front of me on the computer without much effort on my part. Participating in this Early Career Seismic Chief Scientist Training Expedition has changed the way I look at seismic data, now that I’ve experienced how challenging it is to come out and acquire these data firsthand.

A seismic profile of one of the lines imaged on our expedition. Photo: Kittipong Somchat

With a variety of interests in the geological features off the coast of the North Pacific coast of the U.S., it took our 19 expedition participants more than a month over teleconferences to finalize our expedition plan and seismic lines. We left Newport, Oregon excited that this plan will result in a good seven days at sea acquiring non-stop seismic data, but we soon realized that everything was not quite as easy as we expected.

The scientists onboard were divided into three watch standings of 8 hours per day, to monitor data collection, deal with any unique situations that might come up, and adjust the scientific plan accordingly. My watch is during 12 to 8 p.m., and on the first day, we got to deploy all the seismic gear in the water. I got to see an acoustic source and a streamer deployed in the water in front of me, which was really exciting. When we came back into the computer lab, or control room, everything worked fine and we were collecting the first seismic data for this expedition. I was happy; everyone was happy. We passed the control room to the next watch and went to bed.

I woke up the next morning and when I walked into the control room, I could feel in the atmosphere that something was different from the day before. It turned out the acoustic source was not working properly. We had two options: to either skip collecting data in this section or make a loop and come back again after we fixed the problem with the acoustic source. The morning shift decided we would make a loop turn, giving us time to fix the compressor and collect the data in this section again. At the end of the day, we figured out the problem and resumed the process of collecting seismic data.

So far, on this expedition, we have collected approximately 770 kilometers of seismic data. We get to process and see the data we have just collected in real time. I can tell you we all got super excited about this — it is like you are drinking a homemade smoothie from the fruits in your backyard you just picked.

These data will be used in various studies the 19 expedition participants proposed as part of the application for this expedition. For example, Maureen Walczak and Brendan Reilly from Oregon State University will use some of the seismic data to propose drill sites for their interest in paleoclimate studies along the coast of Oregon. Brandi Lenz from Ohio State University is interested in underwater landslides and could use the data for her Ph.D. study. Furthermore, data from this expedition will be available to public afterward and open to any scientists to use for their own research interests.

For myself, I want to use seismic data to study the evolution of the Astoria fan, a submarine fan off the coast, next to the Columbia River, in order to understand sediment transportation of the Columbia River in the past and also study the interactions between climate change events and deep-sea sedimentology.

Now I look at all the seismic data like never before. I got the chance to see how scientists, engineers and ship crew onboard put the effort to acquire seismic data. I appreciate all the people who are involved in all the seismic lines that I work on even more after experiencing how hard is it to be out here on the water collecting data, planning the seismic survey, running into unexpected problems, and having to change our plan (…and getting seasick). But to be honest, I would love to do this again—anytime. It was a fun first time acquiring geophysical data at sea for me.

— Kittipong Somchat is a Ph.D. student at Texas A&M University


Seismically Imaging the Deep-sea Sediments of the Astoria Fan

By John Schmelz

Today is our sixth day at sea, and the opportunity to come out on the R/V Revelle to collect seismic data has been a productive experience. Before this expedition, I had not observed or participated in the collection of marine multichannel seismic data, a data source that I rely on heavily for my research. This experience has been a supplement to my skillset that no amount of time in the classroom could provide. Contributing to the collection of data has offered an invaluable perspective on the tools and techniques that go into producing coherent images of the sedimentary structures below the seafloor, and a better grasp of what these tools do can help me use the end products sensibly. All of this helps me to be a better scientist. As a result, I can better serve the larger community through my work.

This expedition has also been an avenue for me to take ownership in developing research, from the conception of a proposed research plan to collaboratively “steering” the ship. As a third-year Ph.D. student, setting the ship tracks for the R/V Revelle is a rare opportunity. Together with my 18 colleagues participating as early career scientists, we collaborated before the ship set sail to carefully craft waypoints for the ship’s transit around the margin. The planned seismic profile lines were painstakingly set to effectively and efficiently cover our individually proposed scientific objectives. A faulty compressor for the acoustic source dismantled our original plan on day two of the expedition, wasting hours of our precious seven days at sea and forcing cuts to our original track lines.

While the setback was frustrating, there are also great opportunities when collecting data with the ability to adjust plans in real-time. For example, we were able to use information from data processed as the ship was underway to cut out portions of the planned ship track and replace them with shorter segments that would better serve our overall scientific objective. It has been quite an experience to be out here on the Revelle, digesting the major structural elements of a never-before-seen deep-sea fan with my colleagues planning how to better survey it on our next pass through the area. Having this experience will serve me well in other initiatives.

We have been collecting great data over the deep-sea Astoria Fan, the offshore “fan” of sediment and mud created by the Columbia River discharge, and my research interest here on the Cascadian margin. These data might help us understand the processes that create the beautifully complex sedimentary structures found on this convergent continental margin. While it is fascinating in its own right, piecing together how and when the sediments were deposited from this record might also provide some valuable insights that could inform us about the recurrence intervals of major earthquakes on this margin and help us to assess the risks tied to associated geohazards.

The seismic images we collected of this kilometers thick wedge of deep-sea sediment are striking. The Astoria fan had never been imaged by a seismic array like the Scripps Portable Seismic System on the Revelle. The data collected so far has clearly imaged vertically stacked paleo-fan channels, levees, and debris flows. These sediments that make up the modern fan have likely been deposited in the last 760,000 years, through a few cycles of glacial and interglacial periods.

As we plan to look into the finer details of the collected data, it will be interesting to see whether there are patterns of deposition that are repeated through time. These patterns, or sequences of deposition, might hint at whether or not there is a glacial-interglacial pacing to the type of sediment deposited on the Astoria fan. This would support a process of transporting sediment from the Columbia River to the abyssal Astoria fan that depends on changes in sea level. Documenting indications of tectonic activity, such as mass flow deposits and deformational features, and variations in their occurrence through time will also be a focus of the data analysis.

While the initiative is exciting, we probably cannot resolve the entire history of sedimentation with the relatively small amount of seismic data collected here, but the information might guide future research towards testing hypotheses our data support. And this effort in this region is more important than just further improving scientific knowledge, the results could have real-world implications for the residents, administrators, planners, and other stakeholders in communities in coastal Oregon.

This R/V Revelle expedition, that couples the training of 19 aspiring scientists with the collection of seismic data in an area with a data gap and a pressing need for information on earth processes, seems to be a powerful use of ship time. Thank you to Masako, Mitch, Anne, and Greg for putting this together and to NSF and UNOLS for supporting the effort.

— John Schmelz is a Ph.D. student at Rutgers University

Por Qué Yo Exploro

Por Ashley Long

Todavía hay muchas incógnitas cuando se trata de interpretar como la tierra se parecía en el pasado y lo que dictaba como era un cierto lugar. Con el fin de armar una historia sobre los ambientes de paisajes antiguos, científicos necesitan recopilar datos que a menudo requieren mucho tiempo y proporcionan sólo vislumbres en el pasado. Soy una geóloga que está investigando qué controlo el lugar donde los ríos antiguos se encontraban cuando el nivel del mar era mucho más bajo en el estante de Carolina del Sur y cómo estos ríos se llenaron de sedimento a medida que aumentaba el nivel del mar. He descubierto que hay pliegues poco profundos y fallas en el subsuelo que probablemente controlaron los ríos viejos que fluían. Estas fallas y pliegues podrían ser el resultado de terremotos en la región de Myrtle Beach. ¿Pero qué causó los pliegues y fallas, y todavía existen esas condiciones hoy?

Salida del sol en el R / V Roger Revelle, 27 de septiembre de 2017. Foto: Ashley Long

Para responder estas preguntas, todavía necesito un poco de entrenamiento. Me presenté para asistir a la expedición de investigación de Jefe de Ciencias de Carrerra Temprana para obtener la experiencia con el sistema Portatil Multicanal Sísmico (PMS) de Scripps. El uso de esta técnica de adquisición de datos me permite obtener una imagen mas profunda de la tierra y con mejor resolución que el conjunto de datos limitado actualmente disponible para mí. Mediante la adquisición de datos como este en mi área de campo, mis colegas y yo probablemente seremos capaz de determinar la profundidad de las fallas y hasta donde se extiende la zona plegada, y al hacerlo, podemos determinar la edad relativa de la deformación. La experiencia adquirida con esta expedición me permitirá conocer lo suficiente sobre el PMS portátil para planificar mi propia expedición de investigación utilizando esta misma técnica de adquisición de datos.

El trabajo en equipo y el compromiso son la clave para una expedición exitosa como en la que encuentro hoy. Ejecutar una expedición implica cientos de horas de planificación y docenas de personas coordinando en un esfuerzo conjunto, y eso es antes de que llegemos a la nave! Por ejemplo, esta expedición fue propuesta a principios de 2016 para proporcionar capacitación a geocientíficos marinos que podrían estar interesados en usar las herramientas para su investigación, pero que quizás nunca an tenido la oportunidad de ver realmente esas herramientas desplegadas. La ubicación de la expedición se eligió para maximizar su impacto mediante la recopilación de datos en un área del mundo con una comunidad científica establecida interesada en desentrañar la historia tectónica y deposicional del margen de Cascadia.

Como participante en esta expedición, he ayudado a planear donde el barco recopilará datos tomando en consideración los intereses y objetivos de investigación de todos y tomando decisiones difíciles en cuanto a cómo satisfacer las metas científicas de todos. Cuando nos encontramos con problemas, especialmente si una herramienta no funciona correctamente, podemos perder tiempo. Sólo tenemos fondos para un número limitado de días en el barco, por lo que nuestro plan bien pensado para donde recopilaremos datos a veces tiene que ser modificado.

Sin participar en una expedición como esta, no siento que estaría adecuadamente preparada para proponer y planificar mi propia expedicion. De ninguna manera voy a salir de esta experiencia sintiendome como un experto o incluso totalmente preparado para presentar mi primera subvención para ayudar en mi investigación actual. Pero me sentiré mucho más cómoda pidiendole ayuda y consejos a los expertos que he conocido en esta expedición, que potencialmente podrian ser mis colaboradores de investigación en el futuro.

Muchas de las incógnitas que nosotros, como comunidad geológica, enfrentamos, resultan de la falta de datos de áreas inaccesibles. Estas áreas remotas, que pueden incluir las pocas millas de nuestras propias costas, todavía están en una fase de exploración. Para recolectar estos datos, necesitamos tomar decisiones difíciles. ¿Sacrificamos el tiempo lejos de nuestra familia, amigos, y las responsabilidades de enseñanza e investigación y vivimos en aislamiento virtual con personas que apenas conocemos para recoger esos datos? Sabiendo al final que estos datos sólo darán lugar a más preguntas? Para mí, con el apoyo de un marido, que también es un geólogo que entiende lo que quiero lograr y que está feliz de cuidar a nuestros niños en casa por el tiempo que estoy fuera, la respuesta es sí.

— Ashley Long es una estudiante de doctorado en Coastal Carolina University (traducción por Fani Ortiz)

Why I Explore

By Ashley Long

There are still many unknowns when it comes to interpreting what the earth looked like in the past and what dictated what a certain location was like. In order to put together a story about the environments of ancient landscapes, scientists need to collect data that is often time intensive and provides only glimpses into the past. I am a geologist who is investigating what controls where old rivers were when sea level was much lower across the South Carolina Shelf and how these rivers filled with sediment as sea level rose. I have found that there are shallow folds and faults in the subsurface that likely controlled where old rivers flowed. These faults and folds could be the result of earthquakes in the Myrtle Beach region. But what caused the folds and faults, and do those conditions still exist today?

Sunrise on the R/V Roger Revelle, September 27, 2017. Photo: Ashley Long

To answer this question, I still need a bit of training. I applied to attend the Early Career Chief Scientist Training research expedition to gain the experience with the Scripps Portable Multichannel Seismic (MCS). Using this data acquisition technique allows me to image deeper into the earth and with higher resolution than the limited deeper dataset currently available to me. By acquiring data like this in my field area, my colleagues and I will likely be able to determine how deep the faults and folded zone extends; and by doing so, we can determine the relative age of deformation. The experience gained from this expedition will enable me to know enough about the Portable MCS to plan my own research expedition using this same data acquisition technique.

Teamwork and compromise are key to a successful expedition like the one I am on today. Running an expedition involves hundreds of hours of planning and dozens of people coordinating in a joint effort, and that is before we even get on the ship! For example, this expedition was proposed in early 2016, to provide training for marine geoscientists who might be interested in using the tools for their research but may never have the opportunity to actually see those tools deployed. The location of the expedition was chosen to maximize its impact by collecting data in an area of world with an established a large scientific community interested in unraveling the tectonic and depositional history of the Cascadia margin.

As a participant in this expedition, I have helped plan where the ship will collect data by taking into consideration everyone’s research interests and objectives and making hard choices as to how to meet everyone’s scientific goals. When we encounter problems, especially if a tool is not functioning properly, we can lose time. We only have funding for the ship for a limited number of days, so our well-thought-out plan for where we’ll collect data sometimes has to be modified.

Without participating in an expedition like this, I do not feel that I would be adequately prepared to propose and plan my own. By no means will I come out of this experience feeling like an expert or even quite fully prepared to submit my first grant to aid in my current research. But I will feel much more comfortable reaching out to the experts I have met on this expedition for help, advice, and potentially as research collaborators in the future.

Many of the unknowns we, as a geologic community, face result from a lack of data from inaccessible areas. These remote areas, which can include the few miles off of our own coastlines, are still in an exploration phase. To collect these data, we need to make tough decisions. Do we sacrifice the time away from our family, friends, and teaching and research responsibilities and live in virtual isolation with people we hardly know to collect those data? Knowing in the end that these data will result in only more questions? For me, with the support of a husband, who is also a geologist and understands what I want to accomplish and is happy to watch the kids at home alone for the time I am away, the answer is yes.

— Ashley Long is a Ph.D. student at Coastal Carolina University