Daily Summary: We continued our expedition, collecting data for seismic Line 15, over the Diebold Knoll. During the day, we had the opportunity to deploy Expendable Bathy Thermograph (XBT), used to measure the ocean temperature and calculate a sound velocity curve to calibrate bathymetry. Halfway through our day, we were delighted to learn we were 7 hours ahead of schedule, giving us extra seismic data acquisition time. We adjusted our plan accordingly and extended Lines 21 and 22, going over Brendan’s Seep, to acquire data that would give us greater geological context for the region.
Much of what marine geologists study is invisible to the naked eye. While standing on a ship on the surface of the ocean, we can see nothing but a vast expanse of water extending in all directions. From this perspective, the seafloor is hidden by several miles of dense seawater that absorbs light and hides the deepest and darkest portions of the ocean.
But when we cross the threshold separating the deck of the ship from the computer lab we are quickly transported down through the ocean. We suddenly see vast abyssal hills and steeply sloping seamounts displayed on monitors spread throughout the ship. This journey takes us down to a place that has never been exposed to sunlight and where sonars are needed to “see” through the ocean. Using acoustic techniques onboard the R/V Thompson in 2014, we discovered a new seafloor vent, or seep, that releases fresh, warm and fast-flowing water into the overlying ocean. While seafloor seeps are common along continental margins, this seep’s origin is a mystery. My objective during this expedition on the R/V Revelle is to collect acoustic data over the vent to shed light on the geologic history of the site and to provide a window into geochemical process occurring deep within the Cascadia Subduction Zone.
Extending from southern British Columbia to Northern California, the Cascadia Subduction Zone is formed by the collision of the Juan de Fuca oceanic plate and the North American continental plate. Because of its density, the Juan de Fuca plate descends beneath the continent and carries with it oceanic sediments. When these sediments heat up under the increasing pressure of the overlying rock, vast amounts of water are released through mineral dehydration reactions. This water migrates along faults and is often released at the seafloor, supporting dense microbial and macrofaunal communities and contributing gases to the overlying ocean. During transport along faults, this water counteracts the load of the overlying rock and sediments, effectively lubricating the faults and decreasing the likelihood of an earthquake by preventing the accumulation stress. By studying the conditions under which fluids are produced within the seafloor, I hope to improve understanding of the circumstances that lead to earthquake initiation within the Cascadia Subduction Zone.
This seafloor seep, named Pythia’s Oasis after the ancient Oracles of Apollo, is emitting fluids from the seafloor at a rate rarely observed in this type of tectonic setting. During this expedition, I plan to make several passes over the seep using the multichannel seismic system on the R/V Revelle. With this system, I’ll be able to image beneath the seafloor to determine whether there are any faults feeding this seep from below. While the survey data may not point towards a definitive source, the results will help to improve existing hypotheses for the origin of the fluids.
These hypotheses will then be tested during an expedition in 2019 where we’ll use the remotely operated vehicle Jason to dive to the seafloor and collect fluid samples emanating from it. Although that cruise is still over two years away, I can already feel the excitement building as we continue to collect more data and make plans for our return to the site. While progress is slow, each new observation brings us one step closer to the origin of Pythia’s Oasis.
— Brendan Philip is a graduate student at the University of Washington
A major goal of this Early Career Scientist training expedition is giving the participants (a total of 19 “principal investigators” ranging from graduate students to postdocs to faculty) the chance to experience every part of what goes into a full seismic research expedition. One of the most important aspects is being the Chief Scientist during your shift, which means that you are in charge.
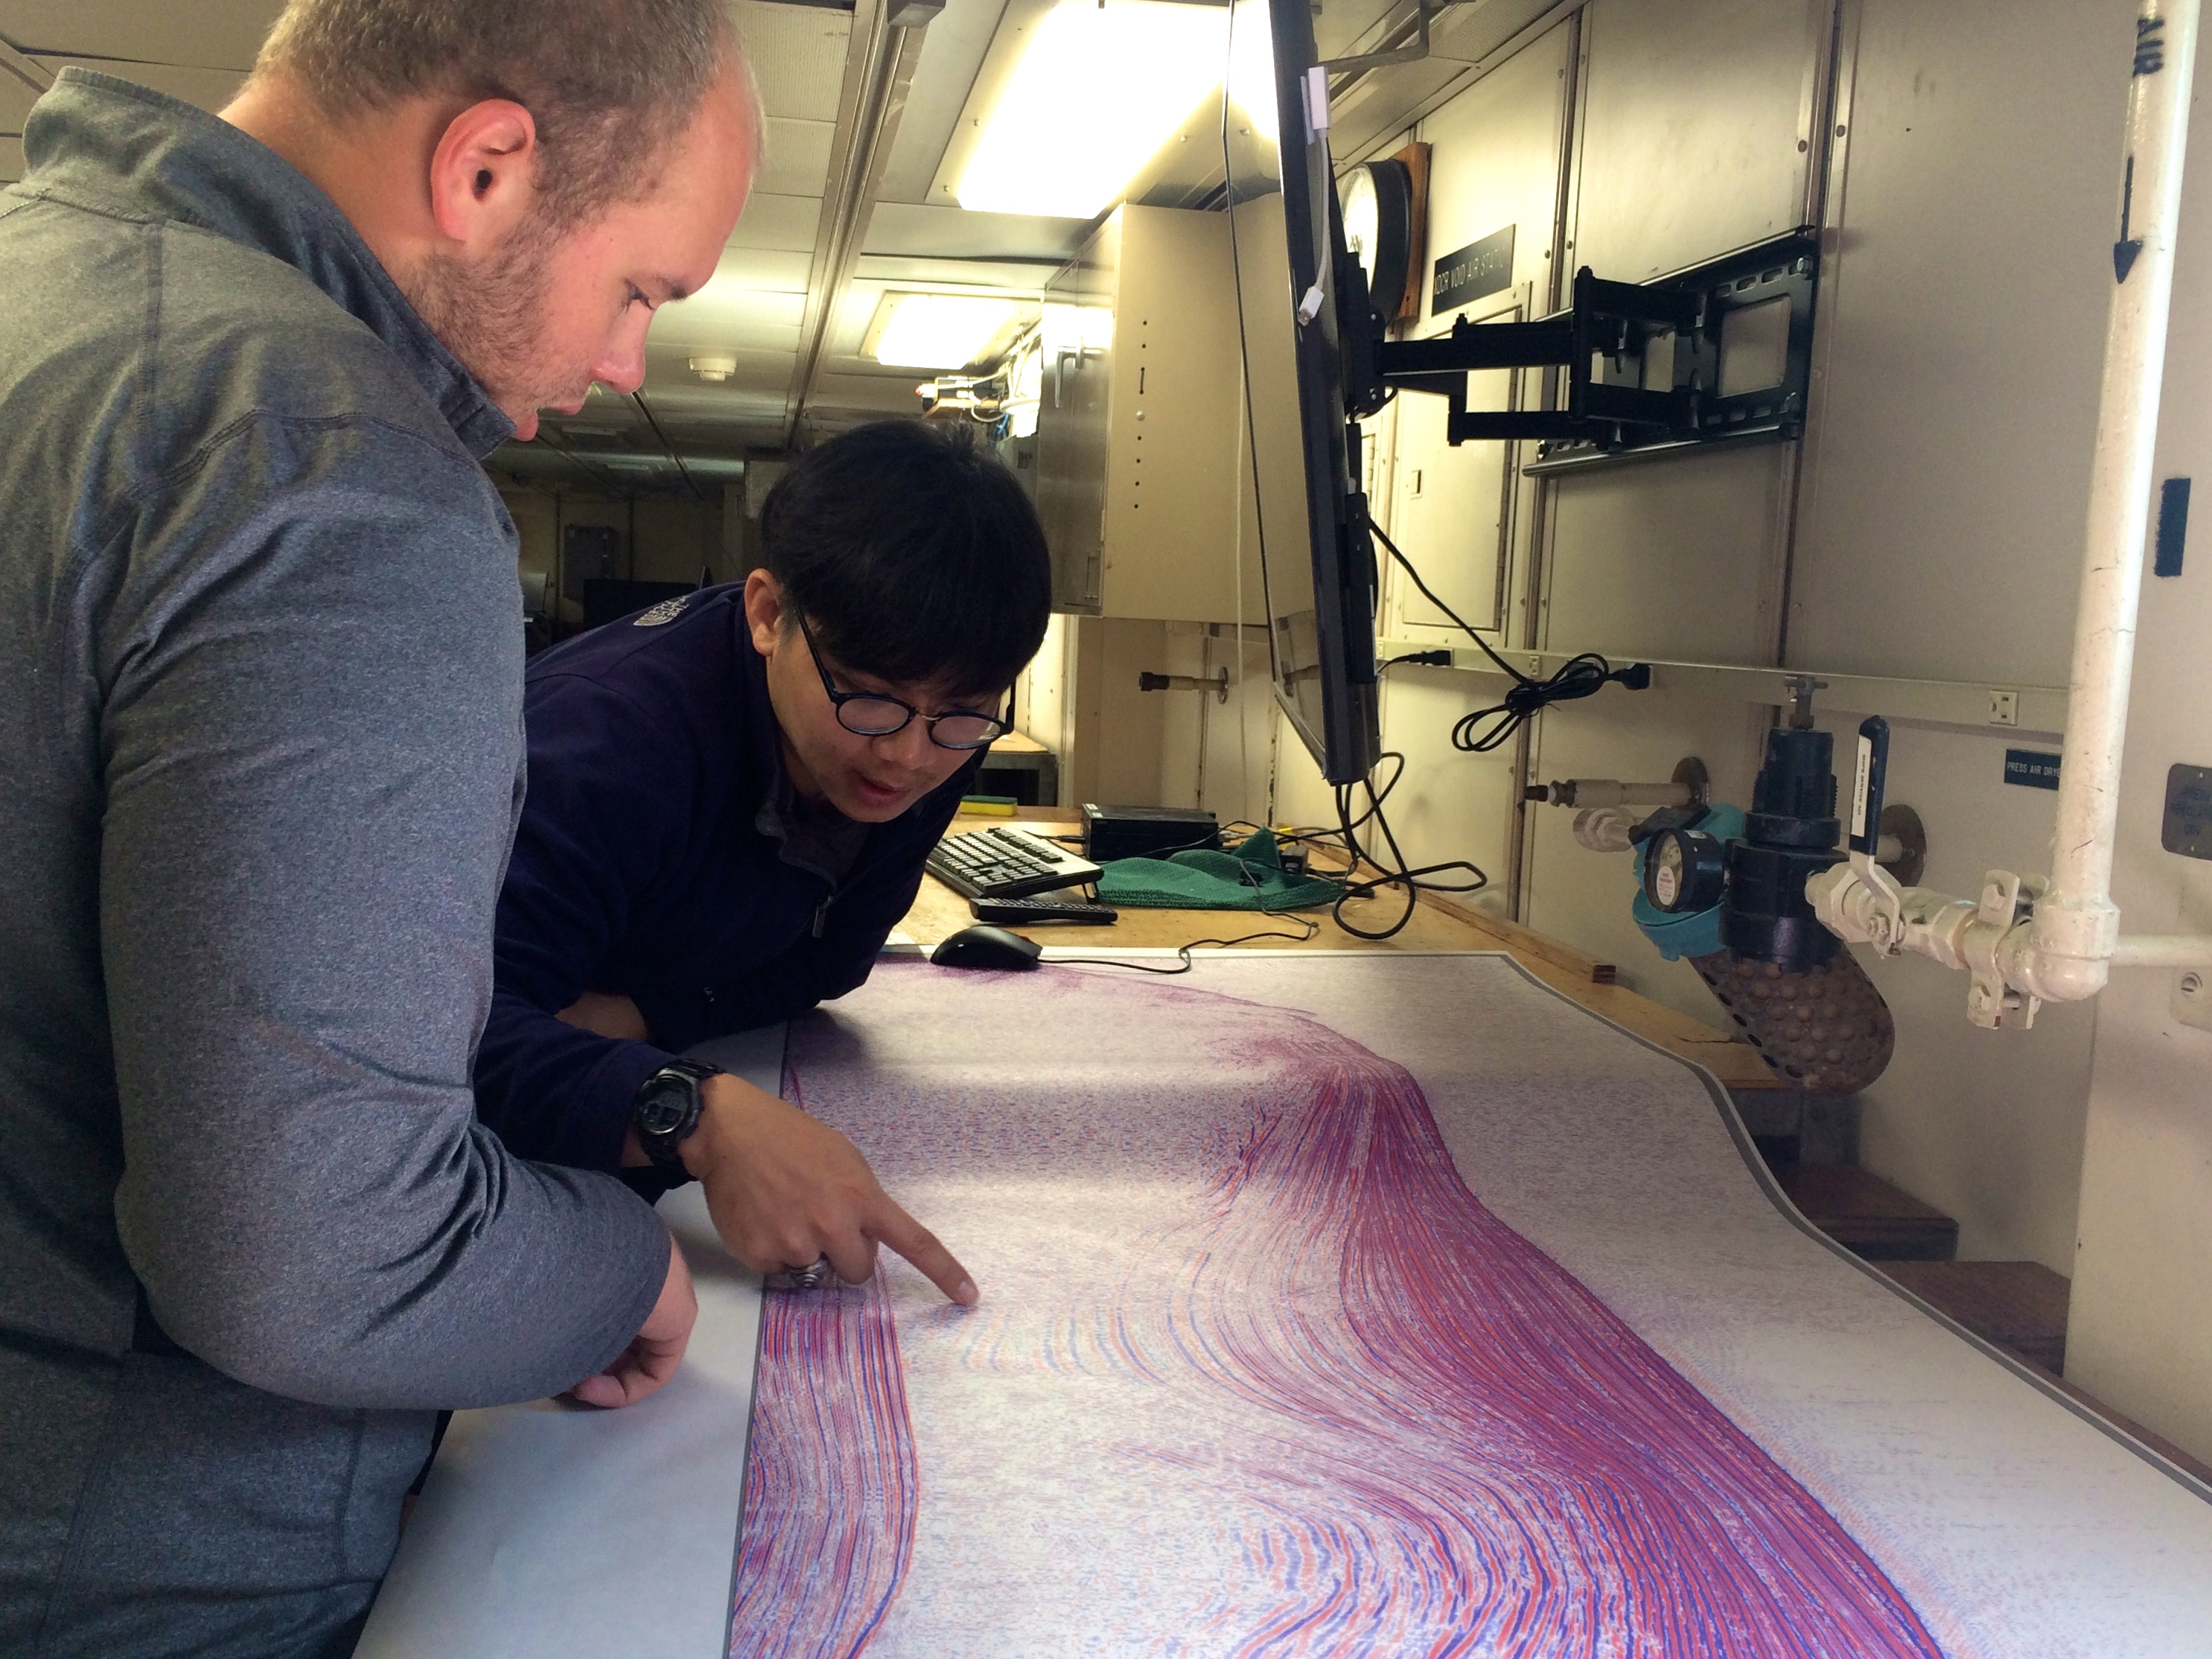
Collin Brandl (left) and Kittipong Somchat examine a seismic profile. Photo: Rebecca Fowler
At the beginning of our watch group’s first shift in the ship’s computer lab (read: control center), from noon to 8 p.m. on Tuesday, our six-person group had to decide on our roles for the day. Graduate student Emily Schottenfels had already been involved in a meeting on the bridge with the Second Mate, so it felt right for her to be the Chief Scientist of our shift; I became the Co-Chief.
One might expect the Chief and Co-Chief Scientists to be figureheads of the watch, especially because we are just students. However, that is definitely not the case. Almost immediately, Emily and I had to run (safely) up the bridge to deliver an update with some changed latitude and longitude coordinates and an updated operation plan.
After this, Emily and I patrolled around the computer lab to make sure all the operations were running smoothly, especially once the gear was deployed and data was being acquired. We also had a discussion with Masako Tominaga and Anne Trehu, two of the project lead scientists, and Lee Ellet, a Scripps’ shipboard geophysical engineer, about the parameters for collecting seismic data. We needed to decide on the source spacing, the sampling rate, and how long we would record for. Ultimately, we chose for the ship to use the acoustic source and then move forward for 25 meters before using it again while we record from that point for 8 seconds and measure the signal every .5 milliseconds. Luckily there were no major issues that arose during our watch, just a few fishing boats that the ship needed to avoid.
Unfortunately, the smooth seas did not last for long (figuratively speaking). As we awoke on the second day of the cruise, we were slowly brought up to speed about some issues that occurred overnight. Luckily, we sailed with an exceptional crew and geophysical engineering team that worked quickly and effectively to solve the problem. It turns out that an important aspect of being the Chief Scientist is working with a variety of people across different groups to keep the expedition running smoothly. Coordinating with Lee, his engineers, and the crew in the engine room was very fast paced but rewarding. By the end of our second day, everything was back to normal and the data was coming in great.
By the end of both shifts/days, I can sincerely say that being the Chief Scientist (or Co-Chief) is badass. The opportunity to be out here at sea and to be in charge of “science-ing” helps to illuminate the future of someone interested in marine geology and geophysics research. You have to make a lot of split-second decisions, communicate a lot of messages to the science crew, and make sure every operation/scientist is running smooth. I am so happy to be here, to be learning, and to have had the chance to be in charge.
— Collin Brandl is a graduate student at the University of New Mexico
Hace dos años, antes de convertirme en estudiante de posgrado, nunca habría pensado que estaría en el mar en una expedición de investigación sísmica. Desde que empecé mi programa de posgrado en la Universidad Texas A&M, tuve la oportunidad de participar en grandes proyectos de investigación: explorando la geología de la secuencia Ofiolita de la Cordillera de la Costa en California y Canadá usando métodos geofísicos, realizando experimentos de magnetismo de nanoescala en la Universidad de Minnesota y Cambridge (Reino Unido), y aprender más sobre las propiedades físicas y químicas de las rocas y cómo interactúan con los fluidos en la Universidad de Leicester (Reino Unido). Ahora estoy a bordo del R/V Revelle (mi primera vez en el mar), recogiendo datos sísmicos multicanal a lo largo del geológicamente complejo Margen de Cascadia.
Fani Ortiz en el laboratorio de informática R/V Revelle. De archivo: Fowler de Rebecca
Para mi investigación de tesis de maestría, mi principal proyecto de investigación se centra en tratar de mejorar la comprensión de cómo medir las señales climáticas registradas en los sedimentos del fondo marino, utilizando una variedad de conjuntos de datos geológicos y geofísicos del Océano Pacífico Ecuatorial Oriental. Esta región del Pacífico se encuentra a pocos grados del ecuador, en el fondo liso sin alterar, en una zona donde se pueden encontrar “altas tasas de acumulación de sedimentos” (0.02 milímetros por año, una pizca de polvo). Esta región tiene unos 400 metros de sedimento sin alterar la capa antes de llegar a la roca dura subyacente a los sedimentos, que registra una gran cantidad de información sobre las condiciones climáticas del pasado que se remonta a hace 28 millones de años. La información extraída de estos sedimentos puede ser utilizada por paleoceonógrafos (científicos que estudian la historia de los océanos) para reconstruir el clima pasado y las condiciones del océano, esta información se utiliza para ayudarnos a entender las condiciones climáticas actuales y esperadas.
Para lograr mi meta de investigación, utilizo datos sísmicos marinos, que son como un ultrasonido de la tierra que me ayuda a imaginar kilómetros bajo el fondo del océano, y muestras de sedimentos recolectadas desde el fondo del océano. Yo, analizo mis muestras de sedimentos para comprender una pequeña área del océano y uso las imágenes sísmicas para correlacionar mis datos a grandes áreas del océano. Con estos datos, busco patrones en mis muestras de roca e imágenes sísmicas para entender cómo el movimiento de sedimentos podría afectar las señales climáticas registradas en los sedimentos medidos.
Sin embargo, para mi proyecto de investigación, no tuve la oportunidad de recopilar mis propios datos sísmicos. Por lo tanto, solicité ser parte del crucero de entrenamiento sísmico ECS con el fin de ganar experiencia en el campo marino. Durante esta expedición, esperaba aprender de geocientíficos de alto nivel cómo diseñar eficientemente mi propio proyecto, incluyendo los desafíos involucrados con la adquisición, procesamiento e interpretación de datos sísmicos marinos.
La expedición ha superado mis expectativas. Desde el primer día nos dieron importantes roles que son cruciales para el éxito de nuestra expedición, incluyendo ser jefe científico, co-jefe científico (roles con mucha responsabilidad incluyendo liderar el equipo científico, comunicarse con el equipo de adquisición de datos sísmicos y el capitán del buque, y asegurar que el trabajo propuesto sea razonable y alcanzable con los recursos disponibles), y procesador sísmico (encargado de evaluar la calidad de los datos adquiridos y procesar los datos sísmicos recogidos a imágenes del subsuelo). Rápidamente aprendimos que la comunicación y la resolución creativa de problemas son la clave para adquirir con éxito datos sísmicos y ayudar a la tripulación del barco a navegar el Revelle a áreas de interés.
El Crucero de Capacitación Sísmica de ECS me ha enseñado cómo trabajar como parte de un equipo en un ambiente de ritmo acelerado y cómo comunicarme exitosamente con compañeros de equipo para lograr los objetivos de investigación. Después de mi experiencia de entrenamiento, me siento más confiada en mi habilidad para ser una científica principal en futuras expediciones marítimas y continuar contribuyendo a la comunidad científica. Mis experiencias de investigación únicas no serían posibles sin el apoyo de la National Science Foundation y un grupo de mentores dedicado que han estado liderando este esfuerzo de capacitación.
— Estefania Ortiz es un estudiante en la Universidad Texas A&M
Two years ago, before I became a graduate student, I would have never thought I would be at sea on a seismic research expedition. Since I began my graduate program at Texas A&M University, I have had the opportunity to be involved in great research projects: exploring the geology of the Coast Range Ophiolite sequence in California and Canada using geophysical methods, conducting nanoscale rock magnetism experiments in the University of Minnesota and Cambridge (UK), and learning more about physical and chemical properties of rocks and how they interact with fluids at the University of Leicester (UK). Now I’m aboard the R/V Revelle (my first time at sea), collecting multichannel seismic data along the geologically complex Cascadia Margin.
Fani Ortiz at work in the R/V Revelle computer lab. Photo: Rebecca Fowler
For my master’s thesis research, my main research project focuses on trying to improve understanding of how to measure climate signals recorded on seafloor sediments, by using a variety of geological and geophysical data sets from the eastern equatorial Pacific Ocean. This region of the Pacific is located a few degrees from the equator, on smooth unaltered seafloor, in an area where “high sediment accumulation rates” (.02 millimeters per year, a sprinkle of dust) can be found. This region has about 400 meters of unaltered sediment cover before we reach the hard rock underlying the sediments, which records a wealth of information about past climate conditions going back to 28 million years ago. The information extracted from these sediments can be used by paleoceaonographers (scientists who study the history of the oceans) to reconstruct past climate and ocean conditions, this information is used to help us understand current and expected climate conditions.
To accomplish my research goal, I use marine seismic data, which is like an ultrasound of the earth that helps me image kilometers under the ocean floor, and sediment samples collected from the ocean floor. I then analyze my sediment samples to understand one small area of the ocean and use seismic images to correlate my data to large areas of the ocean. With this data, I look for patterns in my rock samples and seismic images to understand how sediment movement might affect the climate signals recorded in the measured sediments.
However, for my research project, I did not get the opportunity to collect my own seismic data. So, I applied to be a part of the Seismic ECS Training Cruise in order to gain marine field experience. During this expedition, I hoped to learn from senior geoscientists how to efficiently design my own project, including the challenges involved with the acquisition, processing, and interpretation of marine seismic data.
The expedition has exceeded my expectations. From day one we were given important roles that are crucial to the success of our expedition including being chief scientist, co-chief scientist (roles with a lot of responsibility including leading the science team, communicating with the seismic data acquisition team and ship’s captain, and making sure the proposed work is reasonable and attainable with the available resources), and seismic processer (in charge of assessing the quality of the data acquired, and processing the seismic data collected to images of the subsurface). We quickly learned that communication and creative problem solving are key to successfully acquiring seismic data and helping the ship’s crew navigate the Revelle to areas of interest.
The ECS Seismic Training Cruise has taught me how to work as part of a team in a fast-paced environment, and how to communicate successfully with teammates to accomplish research objectives. After my training experience, I feel more confident in my ability to be a chief scientist in future marine expeditions and to continue contributing to the scientific community. My unique research experiences would not be possible without the support of the National Science Foundation and a dedicated mentor group who has been leading this training effort.
— Fani Ortiz is a graduate student at Texas A&M University
Off the Pacific Northwest coastline lies the Cascadia subduction zone, a region of the Earth where one section of the Earth’s crust (the Juan de Fuca Plate) moves underneath another part of the crust (the North America Plate). Subduction zones produce the largest earthquakes ever recorded, and because most of these subduction zones are underwater (Cascadia included), these earthquakes can also generate deadly tsunamis. Despite this hazard, there are portions of the Cascadia subduction zone offshore Oregon where we do not have information about the structure of the two plates where they connect. Such information can add to our understanding of the tsunami hazard for the Pacific Northwest. Part of the mission of our research expedition on the R/V Revelle is to image the structure of the two plates at the trench where they connect and help fill in some of the present data gaps.
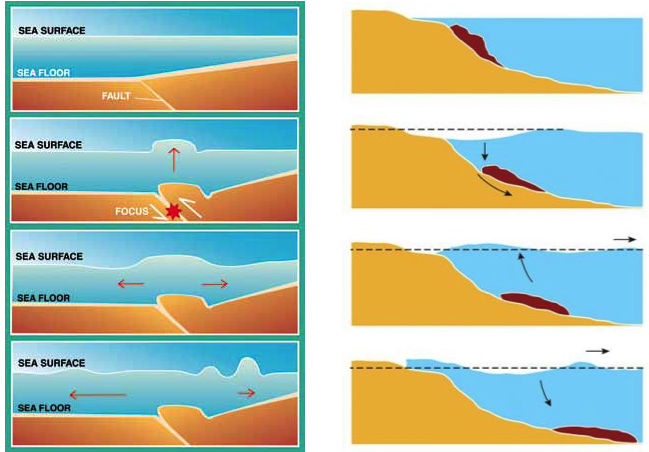
Schematics of how tsunamis are generated by subduction earthquakes (left) and by underwater landslides (right). Images from the TSUMAPS-NEAM Project and from the Istituto Nazionale di Geofisica e Vulcanologia.
Tsunamis caused by large subduction zone earthquakes are some of the most destructive natural hazards on Earth. In addition to the sudden change in the seafloor caused by the earthquake, if an earthquake occurs close to the trench, it can trigger an underwater landslide in the sediment layers at the trench above the shallow section of the fault. Such landslides cause more water to be displaced and add to the height of the tsunami waves that hit the coastline closest to the location of the landslide. This occurred during the devastating magnitude 9.1 Tohoku-oki earthquake that happened in 2011 offshore Japan. The earthquake ruptured into the shallow portion of the subduction zone by the trench and caused an underwater landslide on the northern edge of the earthquake’s rupture area.
Like Japan, the Cascadia subduction zone offshore the Pacific Northwest has experienced large subduction earthquakes in the past and will experience them in the future. The historical earthquake record for this region shows evidence of large tsunamis and underwater landslides, so it is important to develop accurate tsunami early warning systems for the coastal populations in this region.
Local tsunami warning systems in development for Cascadia are using land-based seismic networks (seismometers and accelerometers) and geodetic networks (GPS) to rapidly estimate the characteristics of earthquakes such as starting location, magnitude, and the amount of motion on the fault. These earthquake characteristics can then be put into a tsunami model which calculates the expected wave height and the time it will take for the wave to reach the coastline. This information is the basis for the early warnings issued to the coastal communities of the Pacific Northwest. However, such warning systems will have a difficult time estimating any additional effects caused by underwater landslides because the landslides would occur close to the trench and far from the early warning network’s instruments.
One way to improve tsunami early warnings is to identify regions along the trench that are more likely to collapse in a landslide. If an earthquake occurs close to one of these regions, the warning of the incoming tsunami could be modified to say that there is the possibility of an underwater landslide and that the people closest to the possible slide area should evacuate to even higher ground.
Right now, there is not a lot of data for the near-trench region offshore Oregon that can be used to identify potential future landslide locations. Our expedition on the R/V Revelle will help fill in some of the gaps. This mission targets a past underwater landslide offshore Oregon. By imaging the structure of the slide, we can learn about the conditions that caused the landslide at that location. After we image this region, we will travel northward and image sections of the deformation zone near the trench that have not experienced a large underwater landslide. We hope to use the information from the landslide to assess the possibility of landslides in these locations. These data will greatly improve tsunami early warnings when the next “really big one” occurs.
— Jessie Saunders is a Ph.D. student at Scripps Institution of Oceanography
A large destructive earthquake in the Cascadia Subduction Zone is long overdue. The earthquake, often referred as a megathrust, is expected to produce a tsunami that will affect the western coast of the U.S. and Canada. With this in mind, the region’s coastal population is training to get ready for this event and scientists are working to better understand what it may be like.
In Newport, Oregon, just before boarding the R/V Roger Revelle for this scientific expedition, we had to participate in a mandatory tsunami drill. We walked together to the highest elevation in the port area, which is a designated point for people to gather in case an earthquake and tsunami happen. The necessary supplies of food and water are stored at this muster point, allowing the people affected by tsunami to wait while the water level drops off. Posters with directions and estimated walking times to the muster point are established on the way to the location. These posters serve as mitigation to the expected hazard; they definitely will be crucial for the people affected when this expected earthquake hits the northwest coast of the U.S., and may save many lives.
Tsunami hazard signs in Newport, Oregon. The expected megathrust earthquake will trigger a tsunami that will affect the northwest coast of the U.S. and Canada, so the coastal population is preparing for this event. Image: Irina Filina
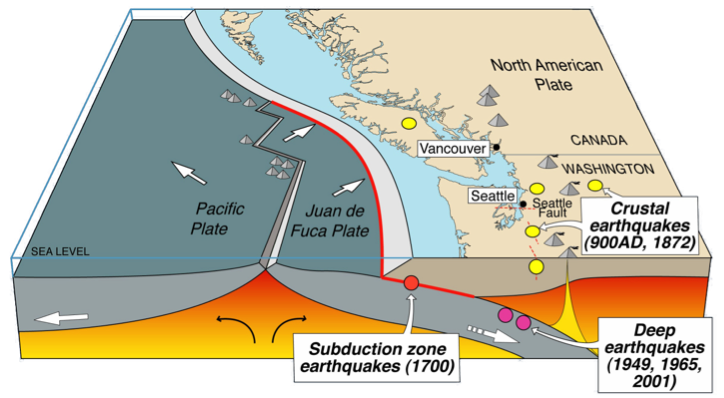
The megathrust in the Cascadia Subduction Zone is associated with the area where the young, oceanic Juan de Fuca plate is sliding under the continental part of the North American plate. In order to assess the hazards, mitigate the damage, and make improved predictions about this potentially devastating event, it’s necessary for scientists to have a reliable and detailed geologic model of the Earth’s lithosphere – the uppermost rigid layer of the planet. This subsurface model consists of information about the thickness and lithological composition of the rocks of both plates, usually organized in layers, such as sedimentary strata, various crustal units, and the upper mantle.
Figure caption: An illustration of the Cascadia Subduction Zone, from http://strangesounds.org. The new oceanic crust is created at the spreading ridge between the Pacific plate and Juan de Fuca plate, so these two plates are pushed away from each other. The Juan de Fuca plate, in turn, slides (or subducts) under the North American plate. The figure also shows the locations of the known historical earthquakes in the Cascadia continental margin. A big (megathrust) earthquake is expected in this subduction zone and will trigger a tsunami and affect coastal regions.
In order to develop a geologic subsurface model, a variety of remote sensing geophysical techniques are used, such as seismic sounding and potential fields (gravity and magnetic) surveying. All of these techniques share the same underlying principle – they use the measurements of some physical phenomena at the Earth’s surface to derive geological information about the rocks in the subsurface. Different methods focus on different physical phenomena – acceleration due to gravitational force is measured for gravity prospecting, the strength and direction of the Earth’s magnetic field are recorded in magnetic surveying, while the ground motion (onshore) or water pressure (offshore) is measured for seismic sounding.
Seismic reflection sounding is the most widely used geophysical method scientists use to map the variations in thickness and lithology of the subsurface layers. This method uses artificially created sound waves that spread through the rocks in the subsurface and are reflected and or refracted at each contact between the different rock layers. The resultant complex pattern of reflected and refracted seismic waves is recorded at some distance from the source of seismic wave.
Interpreting these various seismic arrivals can be challenging and they don’t always provide an interpretation scientists are confident in. In this case, the other geophysical measurements, which record information about the same subsurface, may be integrated with seismic sounding data to constrain the resultant geological model. One of these complementary geophysical techniques is gravity surveying, which is sensitive to variations in the densities between various rock layers in the subsurface. Another technique is magnetic field analysis, which maps the changes in rocks’ magnetic mineral content, described by a physical property named magnetic susceptibility.
A focus of my scientific research is combining records from various geophysical methods together in order to derive a reliable subsurface model that honors all the recorded datasets. During this expedition, the data for all three geophysical methods – seismic sounding, gravity and magnetic readings – are being recorded simultaneously. The integrated analysis of all three datasets together results in a more detailed geological model: the seismic sounding provides the depths to various subsurface layers, while the potential fields allow constraining the lithologies of different geological units (rock layers) based on the derived physical properties, such as densities and magnetic susceptibilities. As the derived geological model should agree with all three datasets, the overall confidence in the result will increase greatly.
The geological model of the Cascadia Subduction Zone that’s created using the data collected during this expedition will improve our understanding of the structures and overall structural architecture of the lithospheric plates involved in the anticipated megathrust. Using this integrated geophysical approach that combines three different methods will result in much more robust and confident subsurface models. These, in turn, will lead to more confident and reliable earthquake prediction and hazard assessments that will help keep citizens of this region safe.
— Irina Filina is an assistant professor at the University of Nebraska-Lincoln
Daily Summary: R/V Revelle completed its transit to the southern portion of the survey region at 06:45 UTC and we deployed the seismic systems. The PSOs spotted dolphins, so we waited for the dolphins to swim a safe distance away before starting the seismic systems. We began Line 14 at 09:14 UTC. We deployed and began magnetometer line M7 at 10:27 UTC. We completed magnetometer Line M7 at 14:52 UTC and Line 14 at 14:55 UTC. We noticed some issues with the hydrophone on the sound source towards the end of Line 14. This was fixed before starting Line 15 at 17:14 UTC. We began magnetometer line M8 at 20:08 UTC after a slight turn at waypoint 24.
So there’s this movie Hollywood came out with a few years back called “San Andreas.” The latest in a proud tradition of dumb, “bad science” summer disaster flicks, I find this movie absolutely fascinating because it is a film about a giant earthquake that gets a fair bit wrong about giant earthquakes.
Take the tsunami, for instance. While it is awesome to see San Francisco leveled by an unstoppable 150-foot wall of water, it is also unlikely to happen because (a) tsunami-causing earthquakes happen near the tsunamis they cause, and (b) the San Andreas fault is many miles inland in the middle of a desert. Also, an earthquake on the San Andreas fault would be very serious, but not nearly as powerful as depicted in the film. It’s too bad, too, because there is a major city in the lower 48 states that is at risk of suffering an earthquake and tsunami as large as, say, the pair that hit Japan back in 2011. It’s not San Francisco or L.A. It’s Seattle.
See, there are these rocks around Seattle that could only have ended up where they are if they were washed ashore by a tsunami, and a big one at that. Although there were likely indigenous people living in the region when the tsunami (and earthquake that presumably caused it) happened, they had no written language, so that disaster and its impact on them were not recorded in the annals of history. For scientists who are concerned with understanding the risk of a large earthquake and/or tsunami happening in Oregon and Washington State, this is pretty frustrating because it tells us that a major earthquake and tsunami must have happened and probably could happen again, but any further details are a little difficult to come by.
How do we go about figuring out where and what could happen? Well, the earthquake we’re worried about caused a tsunami, so it will probably happen offshore. But it also turns out that not all earthquakes cause tsunamis, they need to either be very shallow under the seafloor or near underwater cliffs that can break in landslides. This means that if we had a map of the seafloor we could identify the “problem areas” offshore that could cause a tsunami if an earthquake happened there.
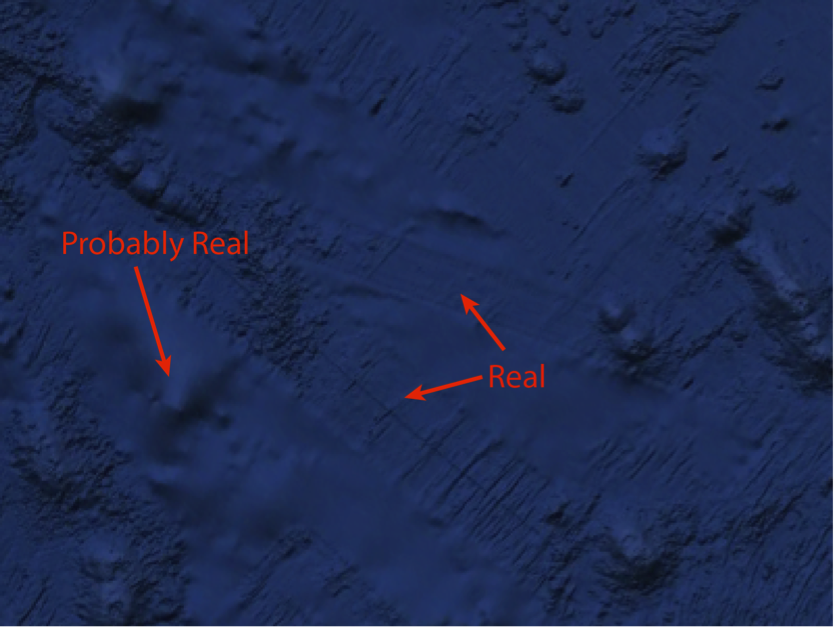
Hey, we do have a map of the seafloor! I’ll just pull out my phone, open up Google Earth and… oh. There are a lot of strange tracks on the seafloor, and they are really detailed. It turns out these tracks are actually real. They are places a ship went to and directly measured the seafloor depth using an instrument called a multibeam sonar, which uses peculiar sounds (called “chirps” because they sound like a bird chirping… every 10 seconds, nonstop, 24/7) to take a picture of the seafloor beneath the ship. The parts of the seafloor that look very smooth are actually our best guess of what the seafloor looks like based on satellite data. But because the satellite data is not as detailed as the multibeam data we think of it as a “hole” in the seafloor map.
Simply put, if we want to figure out where a tsunami could come from, we need to go out on a ship and collect more multibeam data!
A patch of seafloor from Google Earth, showing adjacent areas with and without detailed multibeam data. Image: John DeSanto
While surveying the seafloor, we may also collect seismic data to help us identify which “problem areas” of the seafloor have a nearby fault that can cause a large earthquake. All of a sudden, we would have a much better picture of where large earthquakes and tsunamis could come from and how large they could be.
So here I am out at sea, one of a large group of rugged scientists (almost like in the movies), collecting the multibeam data we need for our map of the seafloor and the seismic data we need to find the faults that could produce a large earthquake. The ocean is pretty vast; this survey will literally be a drop in the bucket. However, every little bit of data helps us present a clearer picture of the earthquake and tsunami risk faced by the residents of Oregon and Washington State. This information is incredibly valuable because it will help us to prepare for the worst-case scenario, saving lives and property in the future.
Perhaps the most disappointing thing about disaster flicks is that there is often evidence a disaster will happen, but no one seems to take it seriously. In reality, this could not be further from the truth. Although the evidence for a large earthquake and tsunami striking Oregon and Washington is subtle, it is certainly real. We’re treating that evidence very seriously so we are not caught off guard in the future.
— John DeSanto is a P.h.D student at Scripps Institution of Oceanography
Subduction zones are regions on the earth’s crust where a tectonic plate (usually the oceanic plate) ‘subducts’ or shears under another plate (usually the continental plate). Subduction zone earthquakes, which happen in many locations globally, can be incredibly devastating depending on their size and potential to cause large tsunamis. This is more so since many of the world’s population centers, such as San Francisco, Tokyo, and many cities in New Zealand, are situated close to subduction zones.
As a graduate student interested in the evolution of subduction ‘megathrusts’ or large subduction zone earthquakes, I study them by conducting small-scale rock friction experiments. I am looking at how friction is different in various locations along the subduction zone and what this means for future earthquakes in these regions.
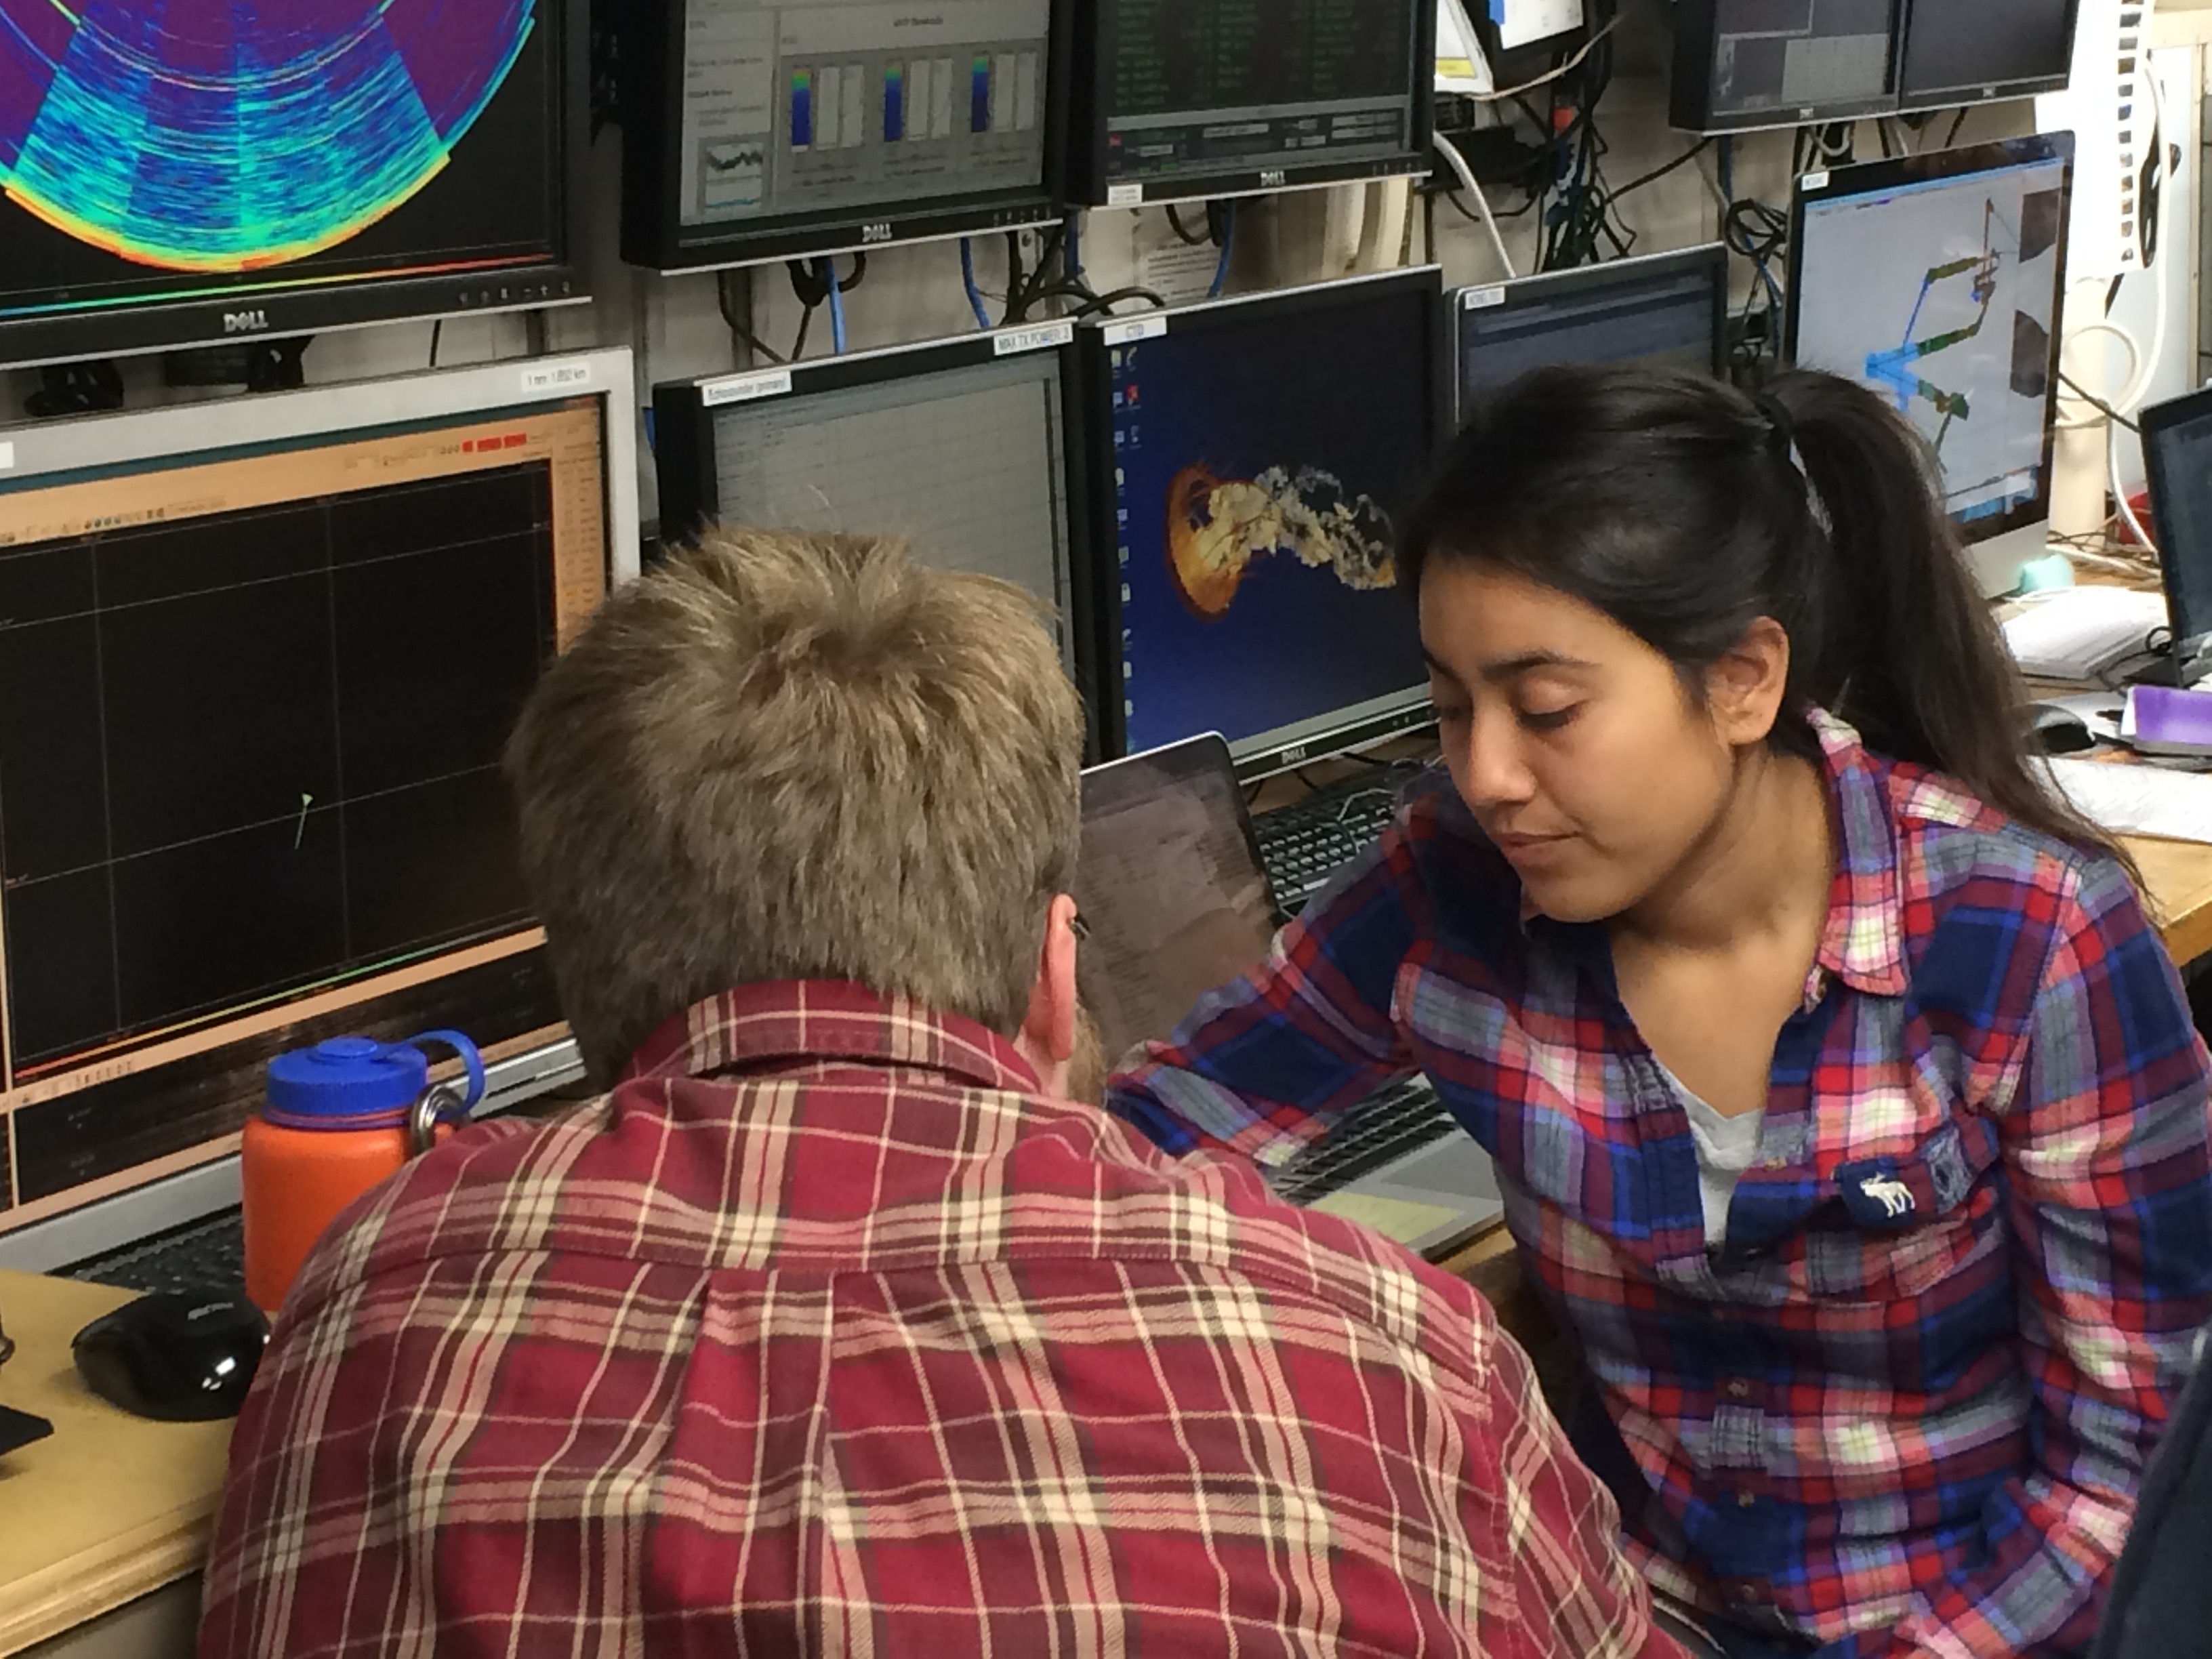
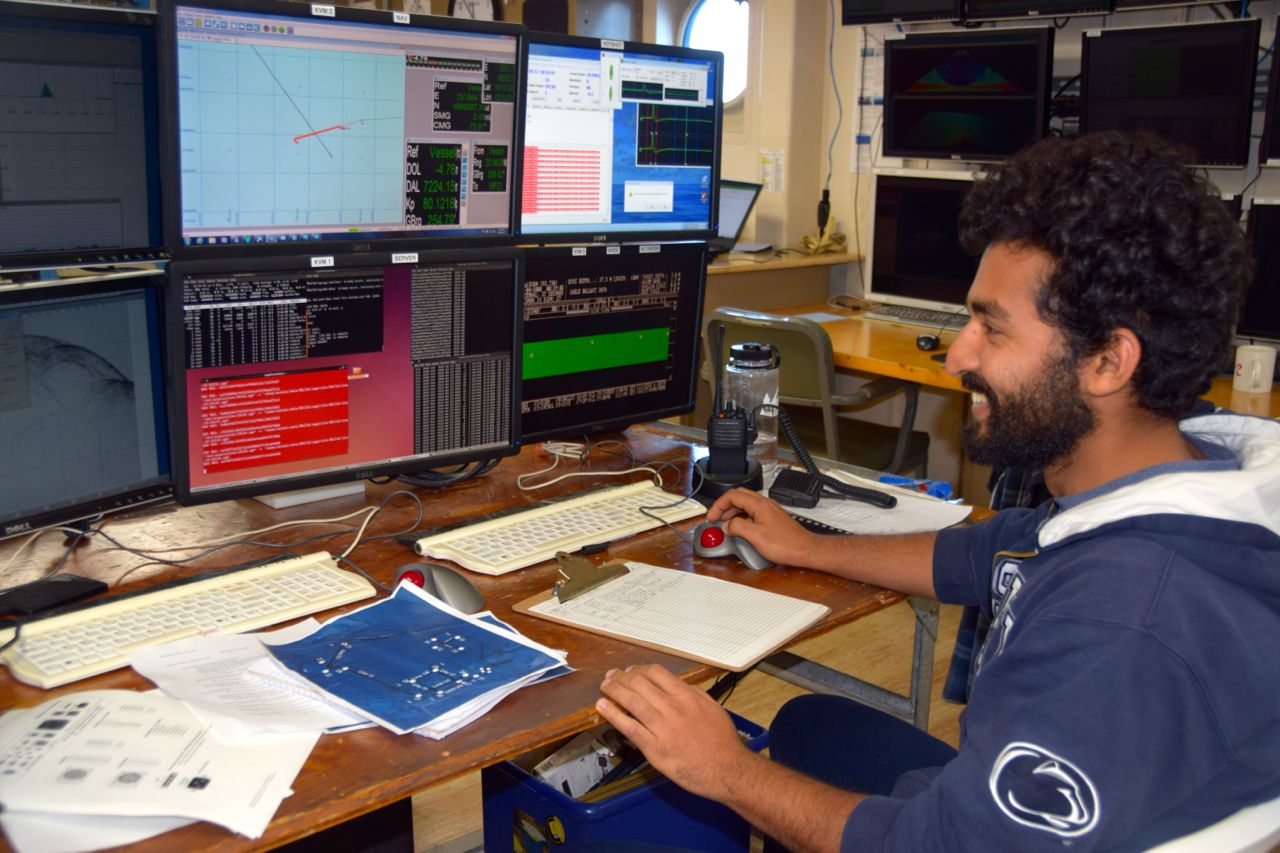
Srisharan Shreedharan keeps an eye on the seismic data acquisition monitoring system during the Early Career Seismic Training Cruise. Photo: Rebecca Fowler
Earthquakes occur on faults, which are simply the interface between the two plates, in the context of subduction zones. Faults, with their not-so-smooth surfaces, thick sediment layers, and fracture zones display a variety of frictional behaviors. Frictionally, faults can be velocity strengthening or weakening. This means that with an increase in fault slip speed (like during an earthquake), the friction of velocity strengthening faults increases. This prevents an earthquake from further propagating because there is now an increased resistance to sliding on the fault. On the opposite end, velocity weakening faults have reduced friction values as their speed increases, and they further promote earthquake rupture, which can grow into very large hazards. If these quakes occur on oceanic faults, the earthquake can even reach the seafloor and create large tsunamis like during the 2011 Tohoku earthquake and the 2004 Sumatra earthquake.
Equipped with this knowledge, I conduct experiments in my lab where I shear, or slide, two small pieces of rock against each other and change their relative velocities to observe how they behave frictionally. I conduct my experiments in a large hydraulic press, which is essentially two hydraulic rams providing a force along the rock-rock interface and perpendicular to it. Sometimes, this results in the creation of stick-slip instabilities, which are really cool small-scale manifestation of earthquakes (or labquakes!).
There is evidence (based on the type of experiments I described earlier) that smectite, a type of clay, exhibits velocity weakening behavior over the pressure – temperature regimes necessary to propagate earthquake rupture near the seafloor close to the subduction zone. Scientists have studied subduction zones around the world for many decades now, and they have recently discovered that not all subduction zone earthquakes reach the seafloor. Based on these two observations, my work here at the Cascadia Margin is to image beneath the seafloor at different locations along the margin. I am looking for changes in fault structure over time. To do this, I plan to re-survey a region, which was last surveyed over two decades ago. Fault displacement/shift, if any, will give me more insight into how close to the seafloor the earthquakes from the past 20 years may have propagated. My survey line also goes over a scientific site that was last visited over 40 years ago.
I will combine the new seismic data from this survey with the existing data to accurately describe the many layers of rock and sediment that will invariably show up in my sub-sea floor images. I plan on using these datasets as a baseline to comment on the presence/absence of sediment layers (eg. smectite) in other seismic images acquired during the cruise. This will help me make an informed judgement about the potential for large tsunamis at various locations along the west coast.
In many ways, laboratory and field studies go hand in hand, especially in the context of earthquakes. Not all kinds of data can be collected in the field due to time constraints, instruments sometimes break down and there are field constraints such as bad weather. Experiments conducted on a much smaller scale provide us with the flexibility of exploring a larger set of parameters to explore. This helps build an intuitive understanding of how larger scale hazards like earthquakes and tsunamis work in nature. It also helps us build testable hypotheses and theories that we can back up — or refute — based on field scale observations. Ultimately, these experiments and studies help us, as a population, build better early-warning instruments, create more robust building codes in extremely earthquake-prone areas, and create tsunami resistant structures in coastal areas.
— Srisharan Shreedharan is a Ph.D. student at Penn State University