You Will Not Feel It on the East Coast

By John DeSanto

So there’s this movie Hollywood came out with a few years back called “San Andreas.” The latest in a proud tradition of dumb, “bad science” summer disaster flicks, I find this movie absolutely fascinating because it is a film about a giant earthquake that gets a fair bit wrong about giant earthquakes.

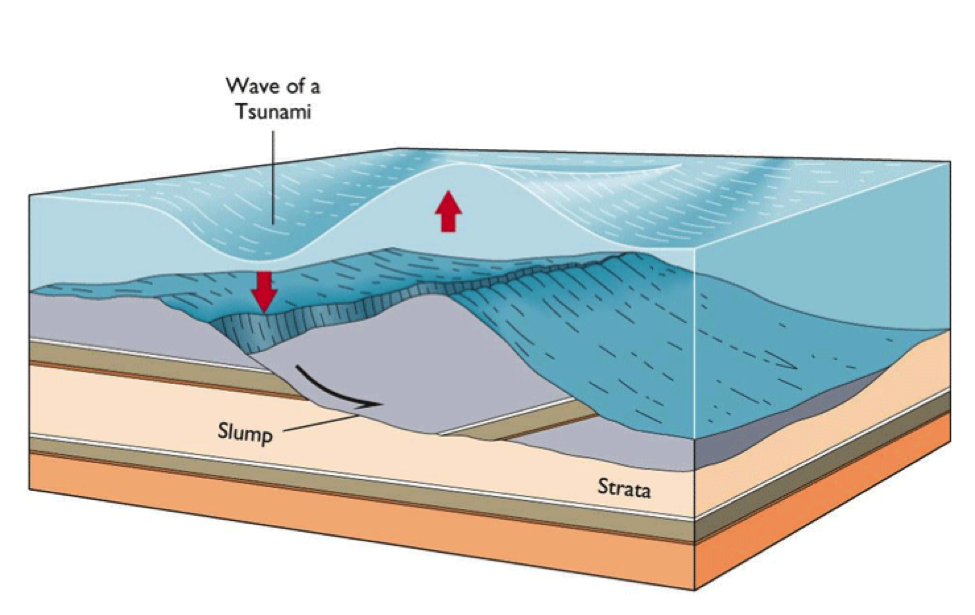
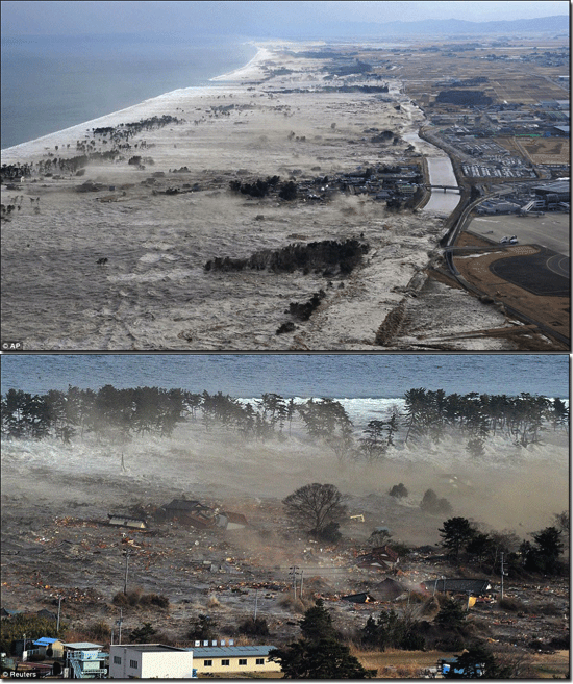
Take the tsunami, for instance. While it is awesome to see San Francisco leveled by an unstoppable 150-foot wall of water, it is also unlikely to happen because (a) tsunami-causing earthquakes happen near the tsunamis they cause, and (b) the San Andreas fault is many miles inland in the middle of a desert. Also, an earthquake on the San Andreas fault would be very serious, but not nearly as powerful as depicted in the film. It’s too bad, too, because there is a major city in the lower 48 states that is at risk of suffering an earthquake and tsunami as large as, say, the pair that hit Japan back in 2011. It’s not San Francisco or L.A. It’s Seattle.

See, there are these rocks around Seattle that could only have ended up where they are if they were washed ashore by a tsunami, and a big one at that. Although there were likely indigenous people living in the region when the tsunami (and earthquake that presumably caused it) happened, they had no written language, so that disaster and its impact on them were not recorded in the annals of history. For scientists who are concerned with understanding the risk of a large earthquake and/or tsunami happening in Oregon and Washington State, this is pretty frustrating because it tells us that a major earthquake and tsunami must have happened and probably could happen again, but any further details are a little difficult to come by.

How do we go about figuring out where and what could happen? Well, the earthquake we’re worried about caused a tsunami, so it will probably happen offshore. But it also turns out that not all earthquakes cause tsunamis, they need to either be very shallow under the seafloor or near underwater cliffs that can break in landslides. This means that if we had a map of the seafloor we could identify the “problem areas” offshore that could cause a tsunami if an earthquake happened there.

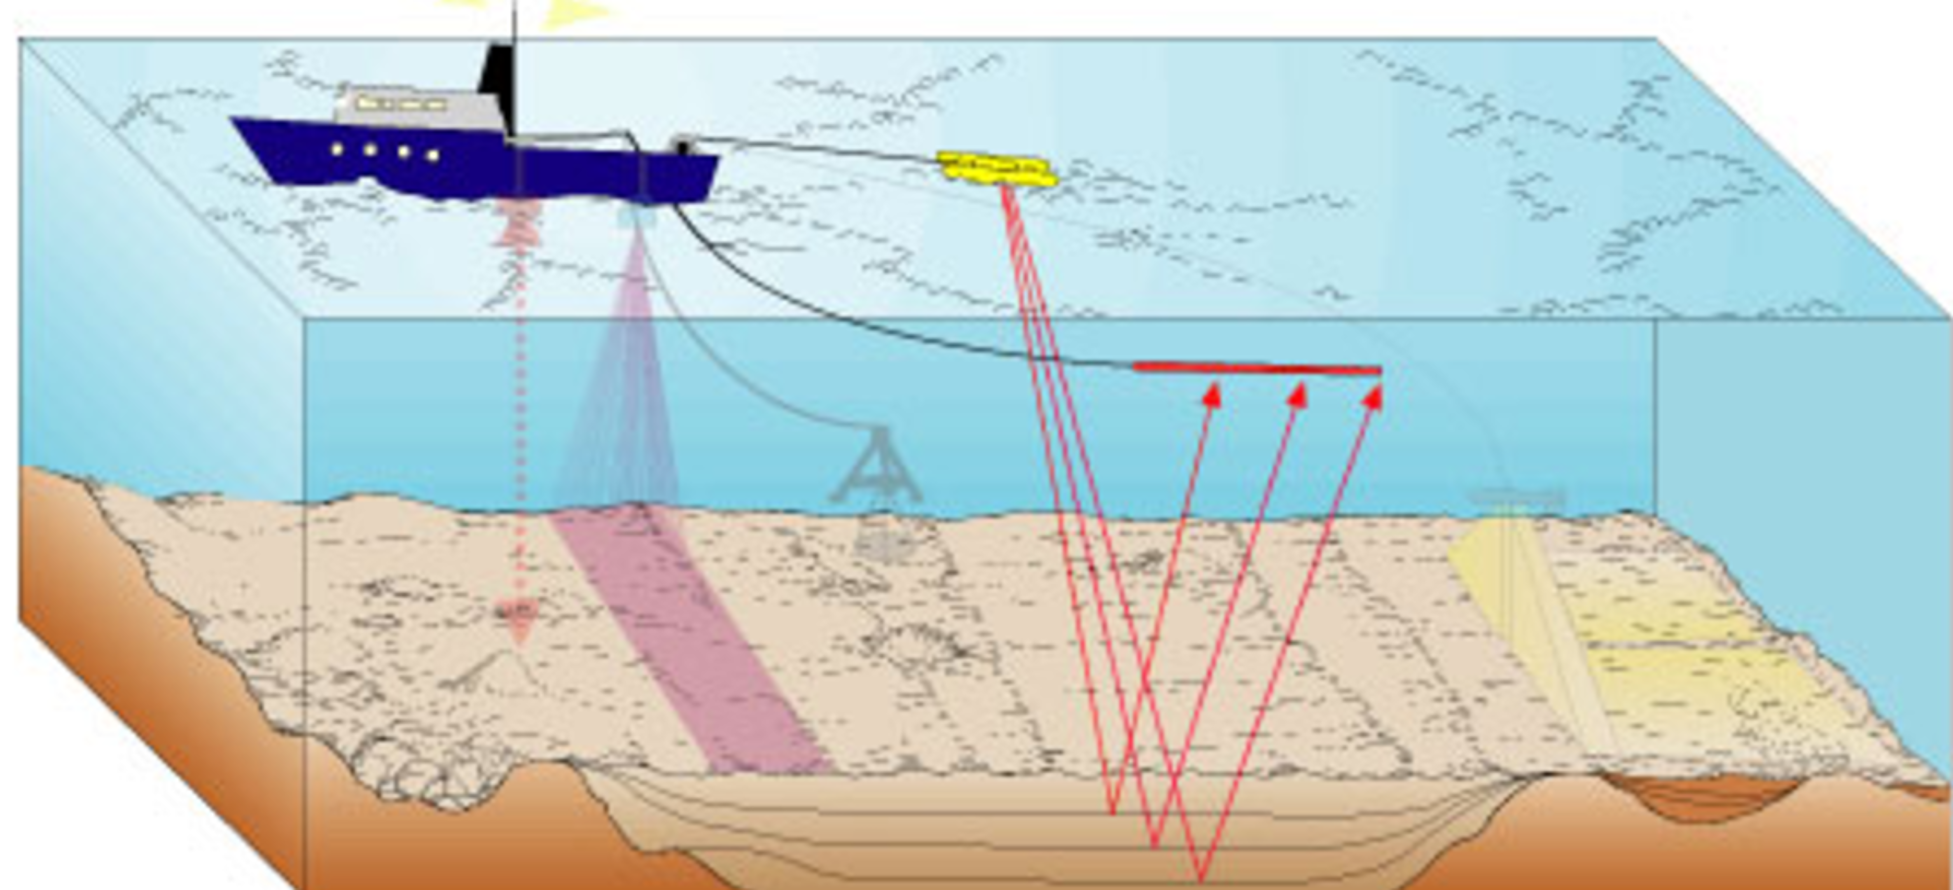
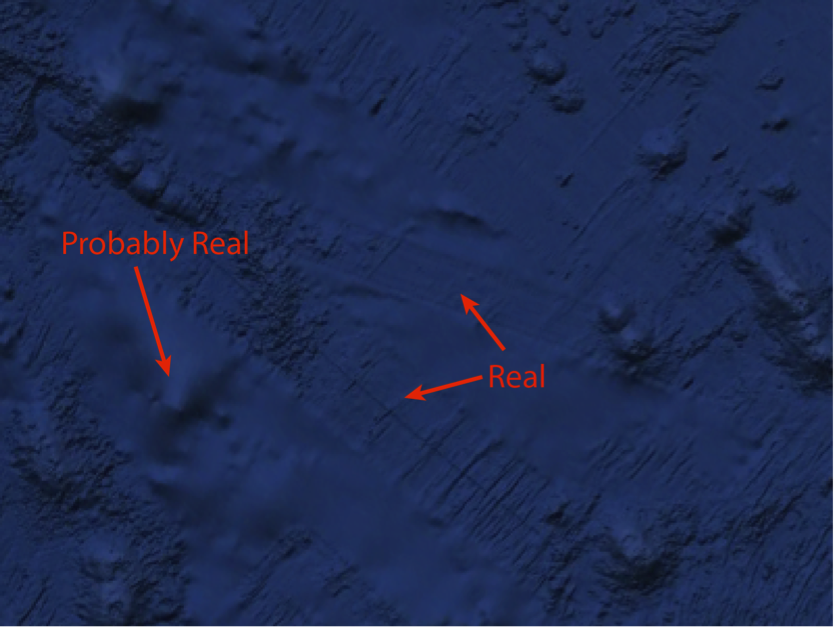
Hey, we do have a map of the seafloor! I’ll just pull out my phone, open up Google Earth and… oh. There are a lot of strange tracks on the seafloor, and they are really detailed. It turns out these tracks are actually real. They are places a ship went to and directly measured the seafloor depth using an instrument called a multibeam sonar, which uses peculiar sounds (called “chirps” because they sound like a bird chirping… every 10 seconds, nonstop, 24/7) to take a picture of the seafloor beneath the ship. The parts of the seafloor that look very smooth are actually our best guess of what the seafloor looks like based on satellite data. But because the satellite data is not as detailed as the multibeam data we think of it as a “hole” in the seafloor map.

Simply put, if we want to figure out where a tsunami could come from, we need to go out on a ship and collect more multibeam data!

A patch of seafloor from Google Earth, showing adjacent areas with and without detailed multibeam data. Image: John DeSanto

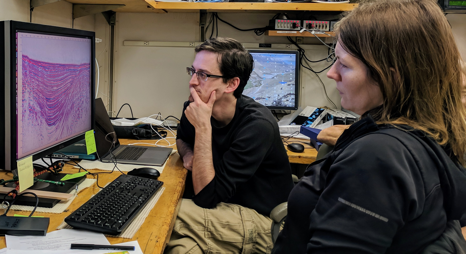
While surveying the seafloor, we may also collect seismic data to help us identify which “problem areas” of the seafloor have a nearby fault that can cause a large earthquake. All of a sudden, we would have a much better picture of where large earthquakes and tsunamis could come from and how large they could be.

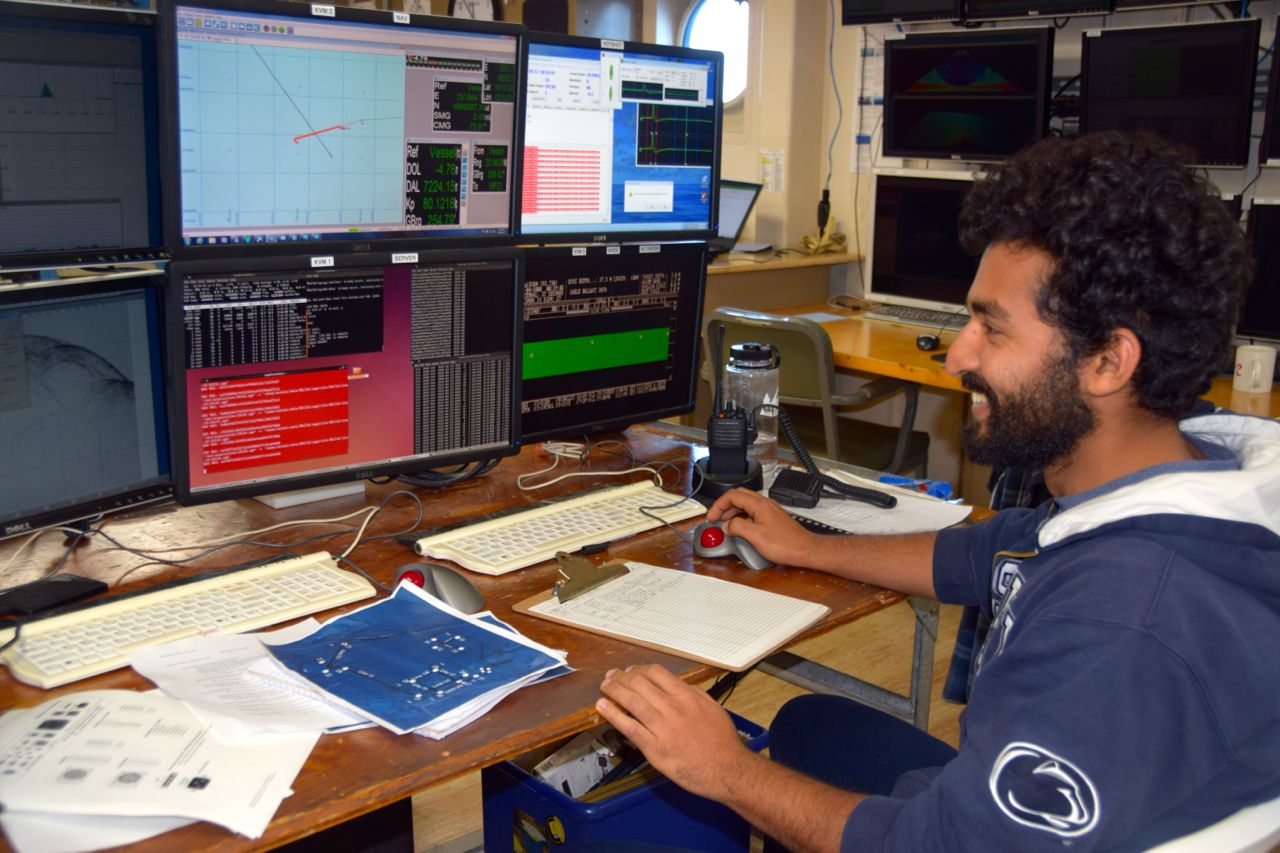
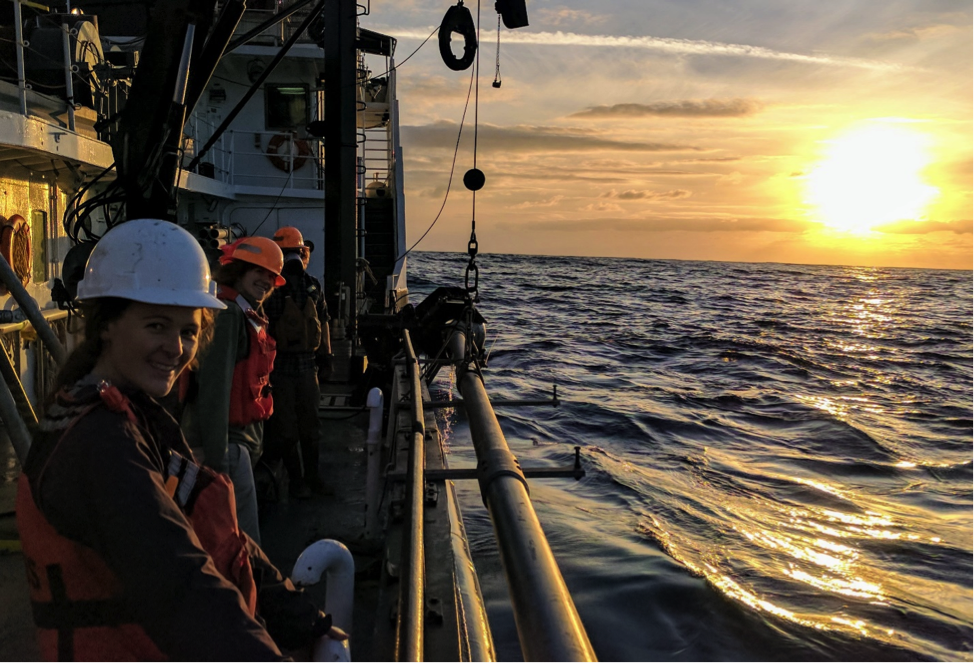
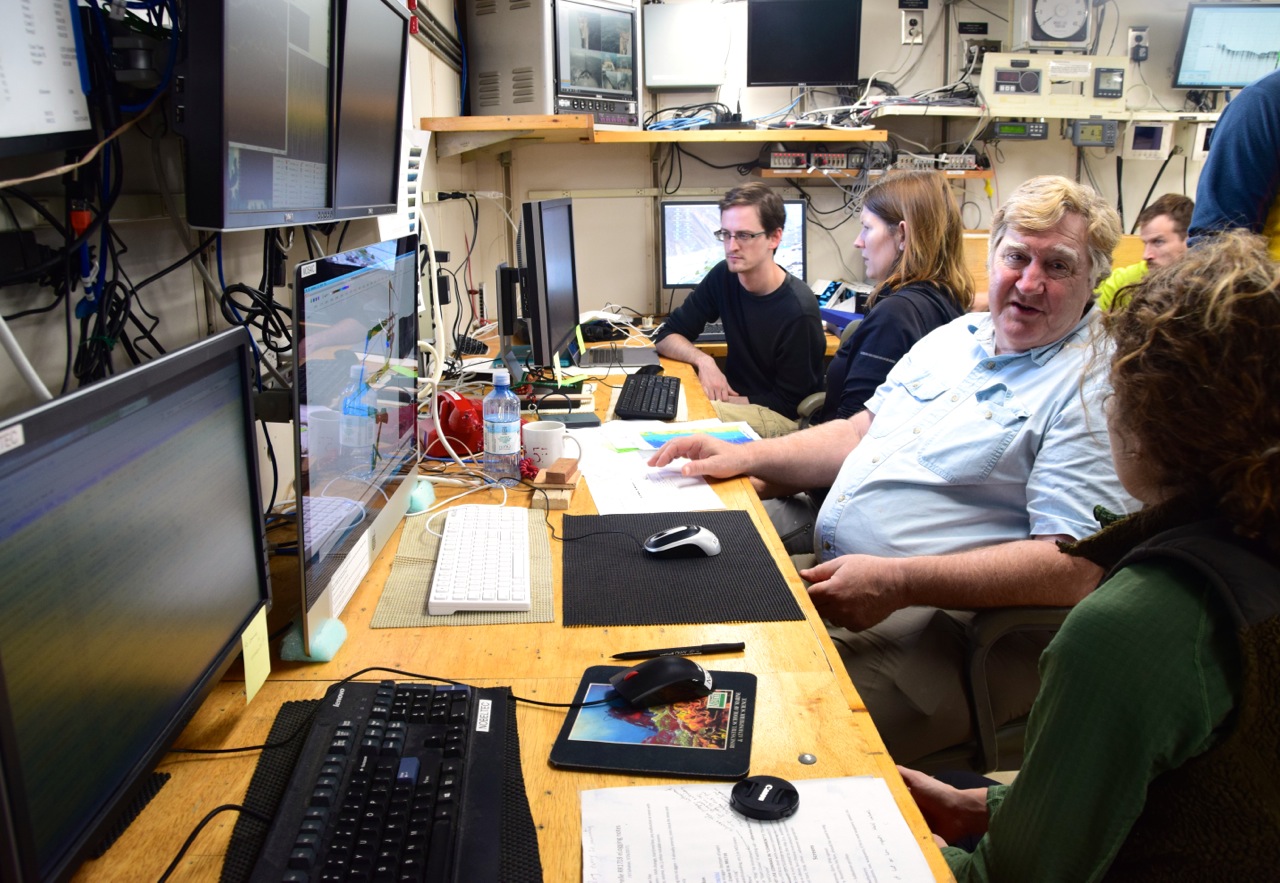
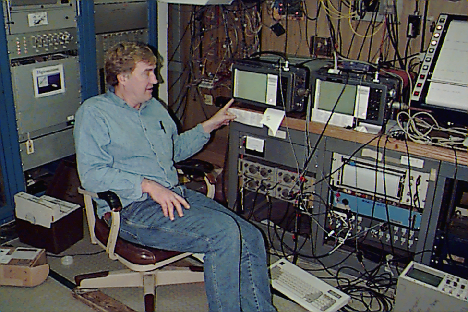
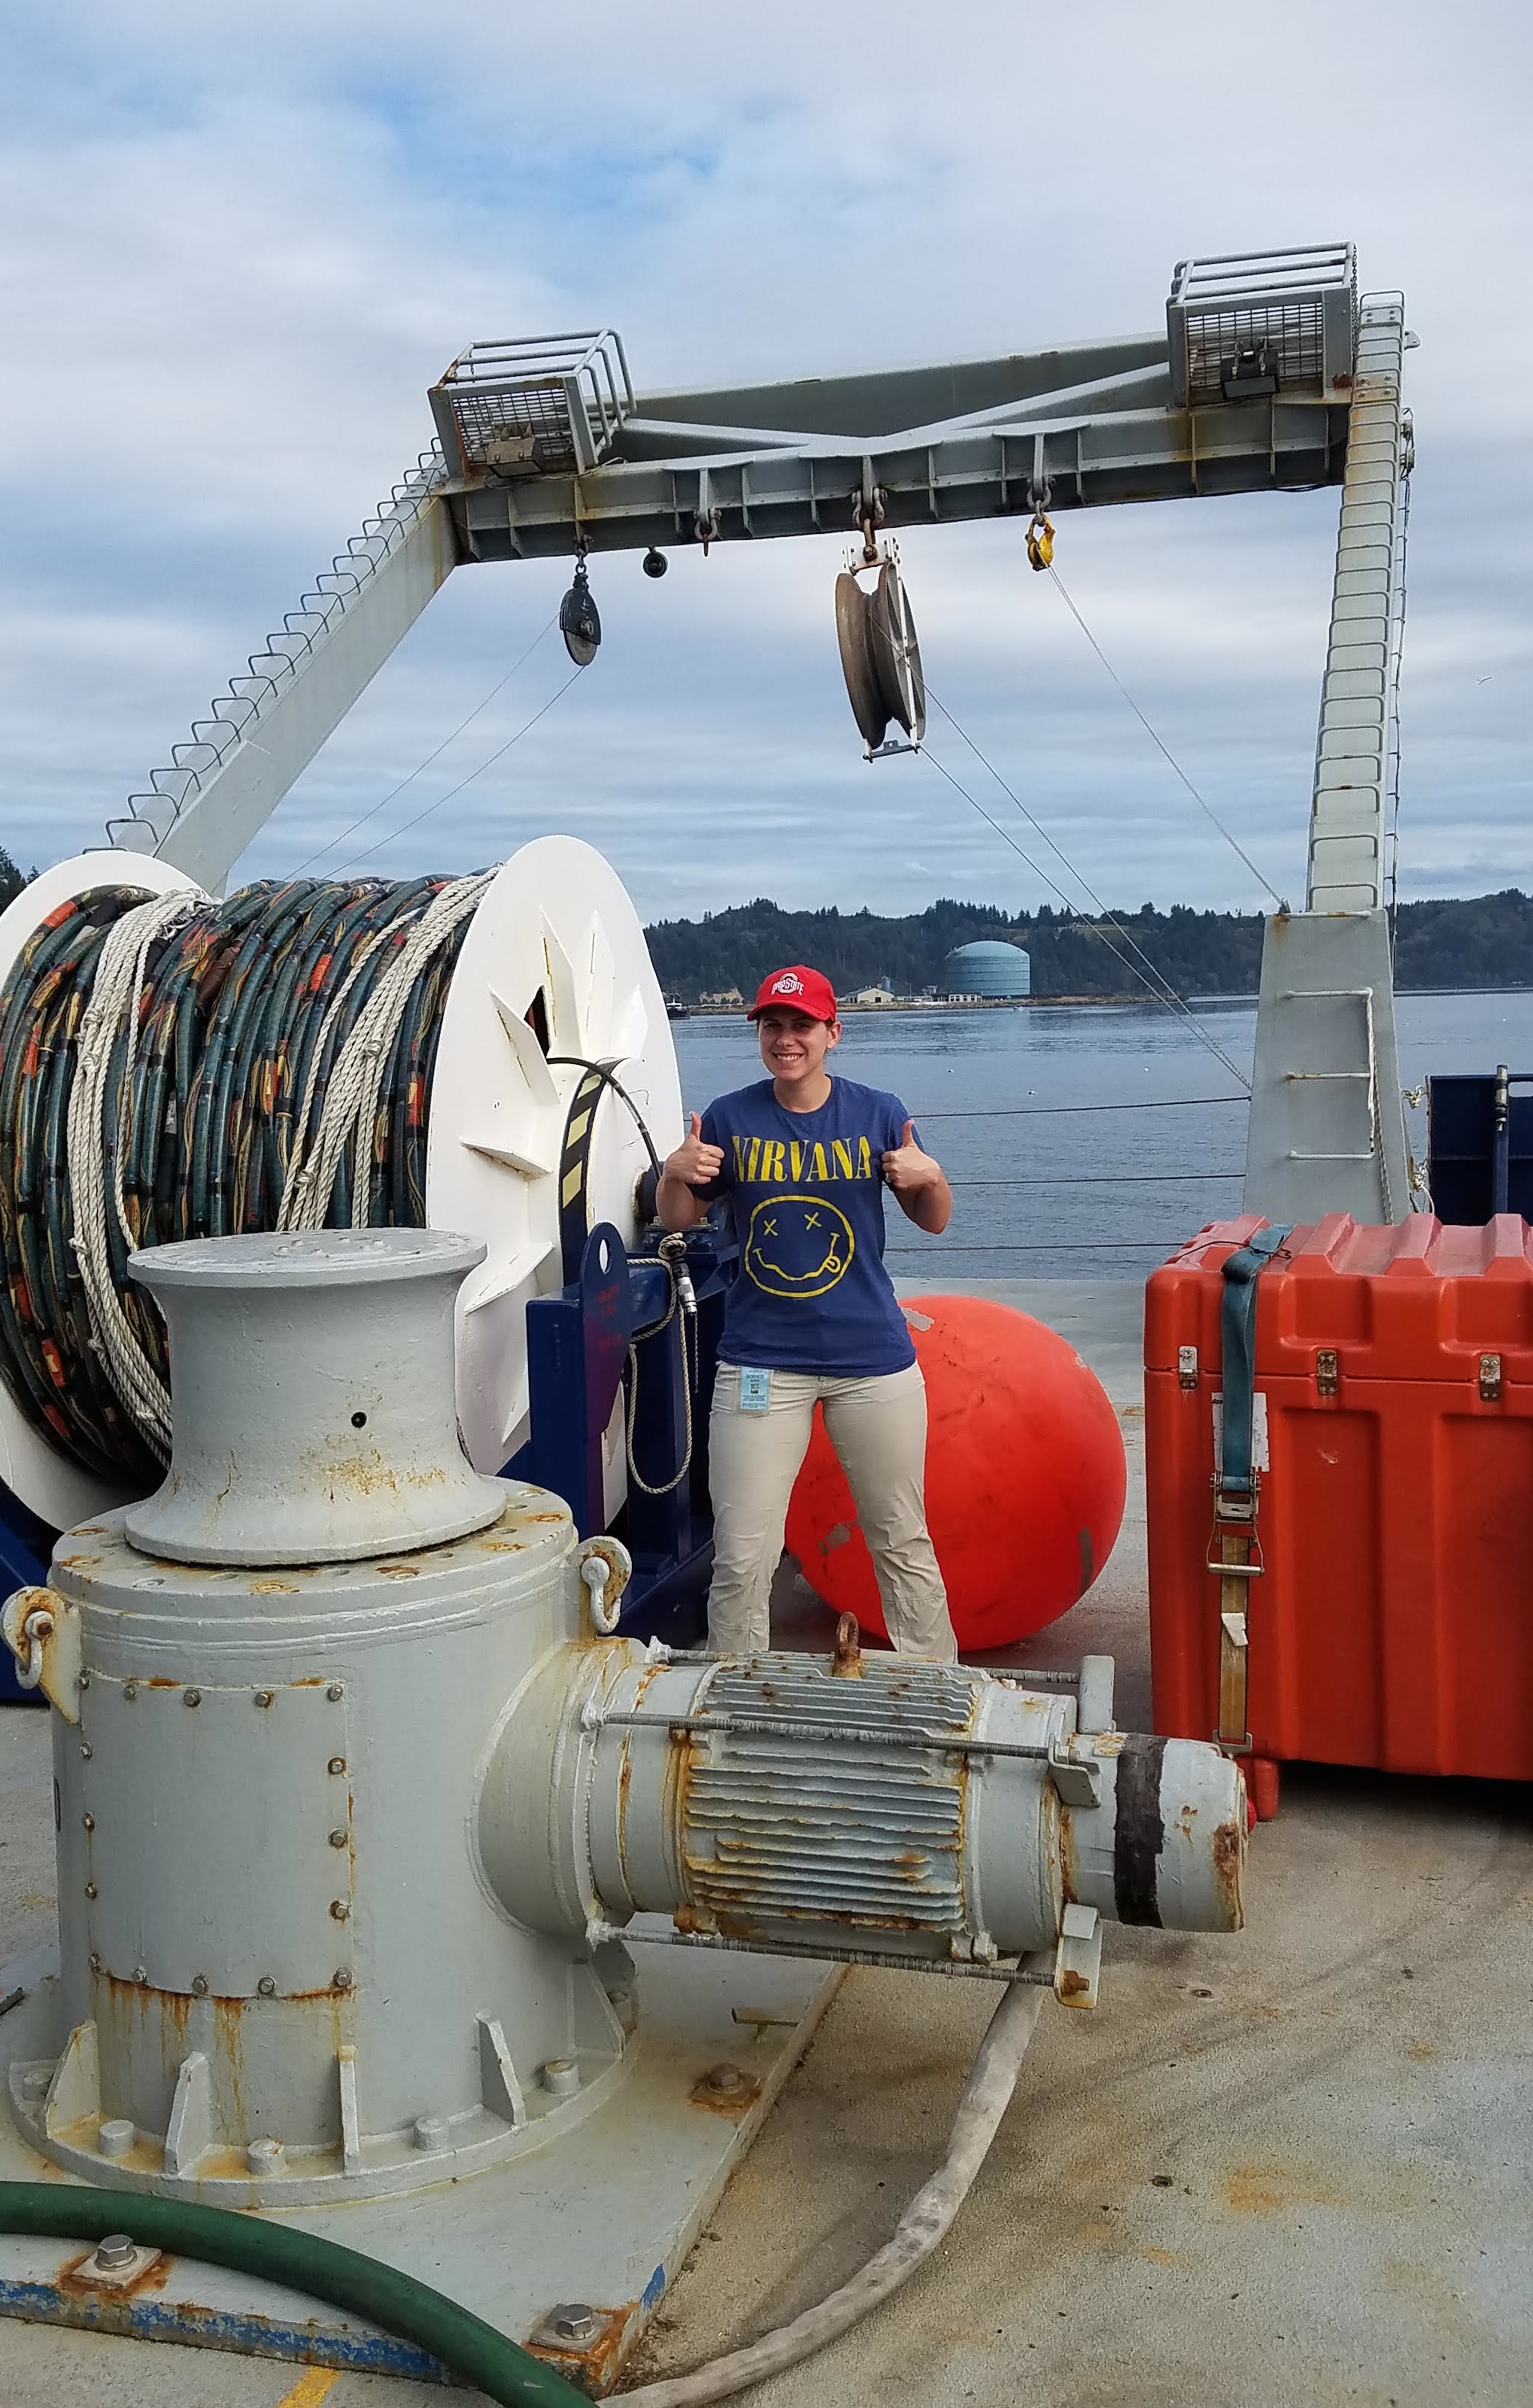
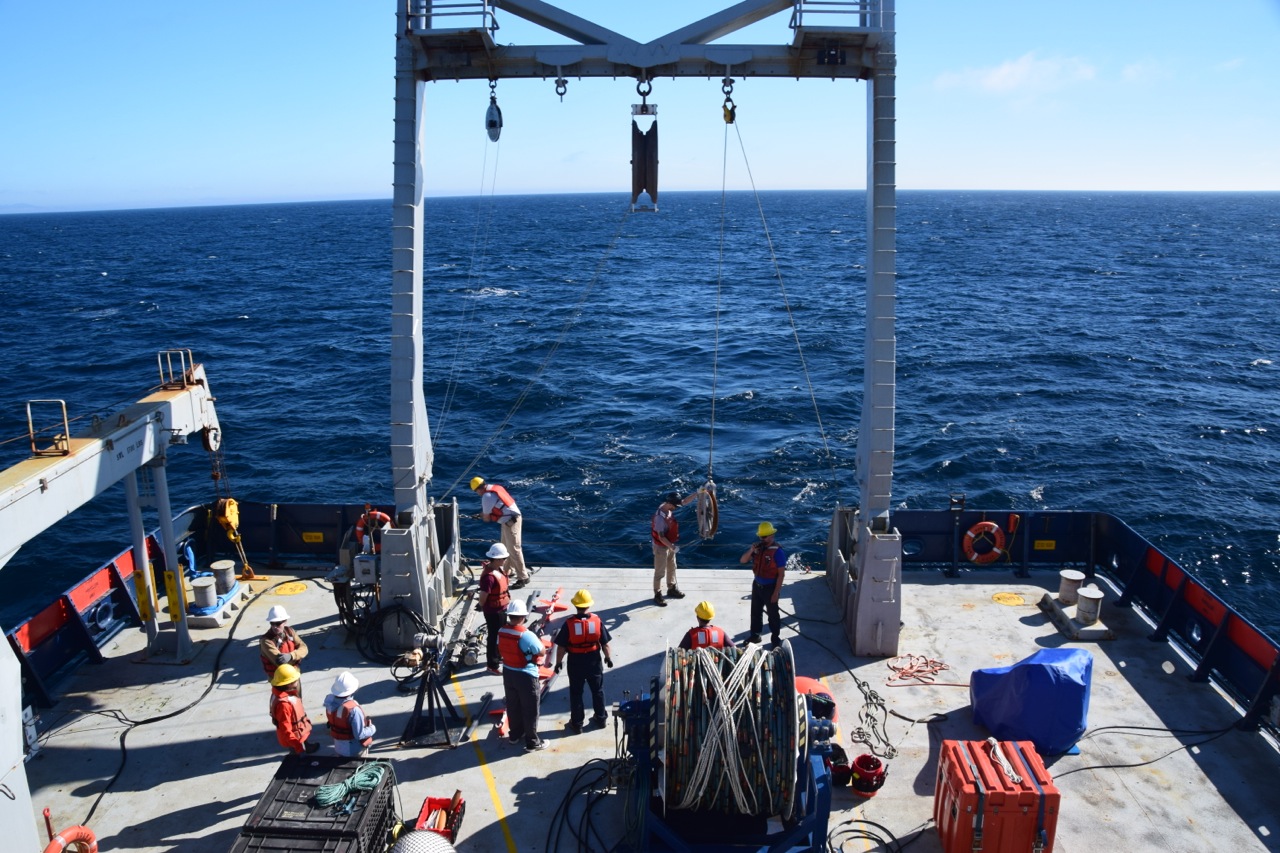
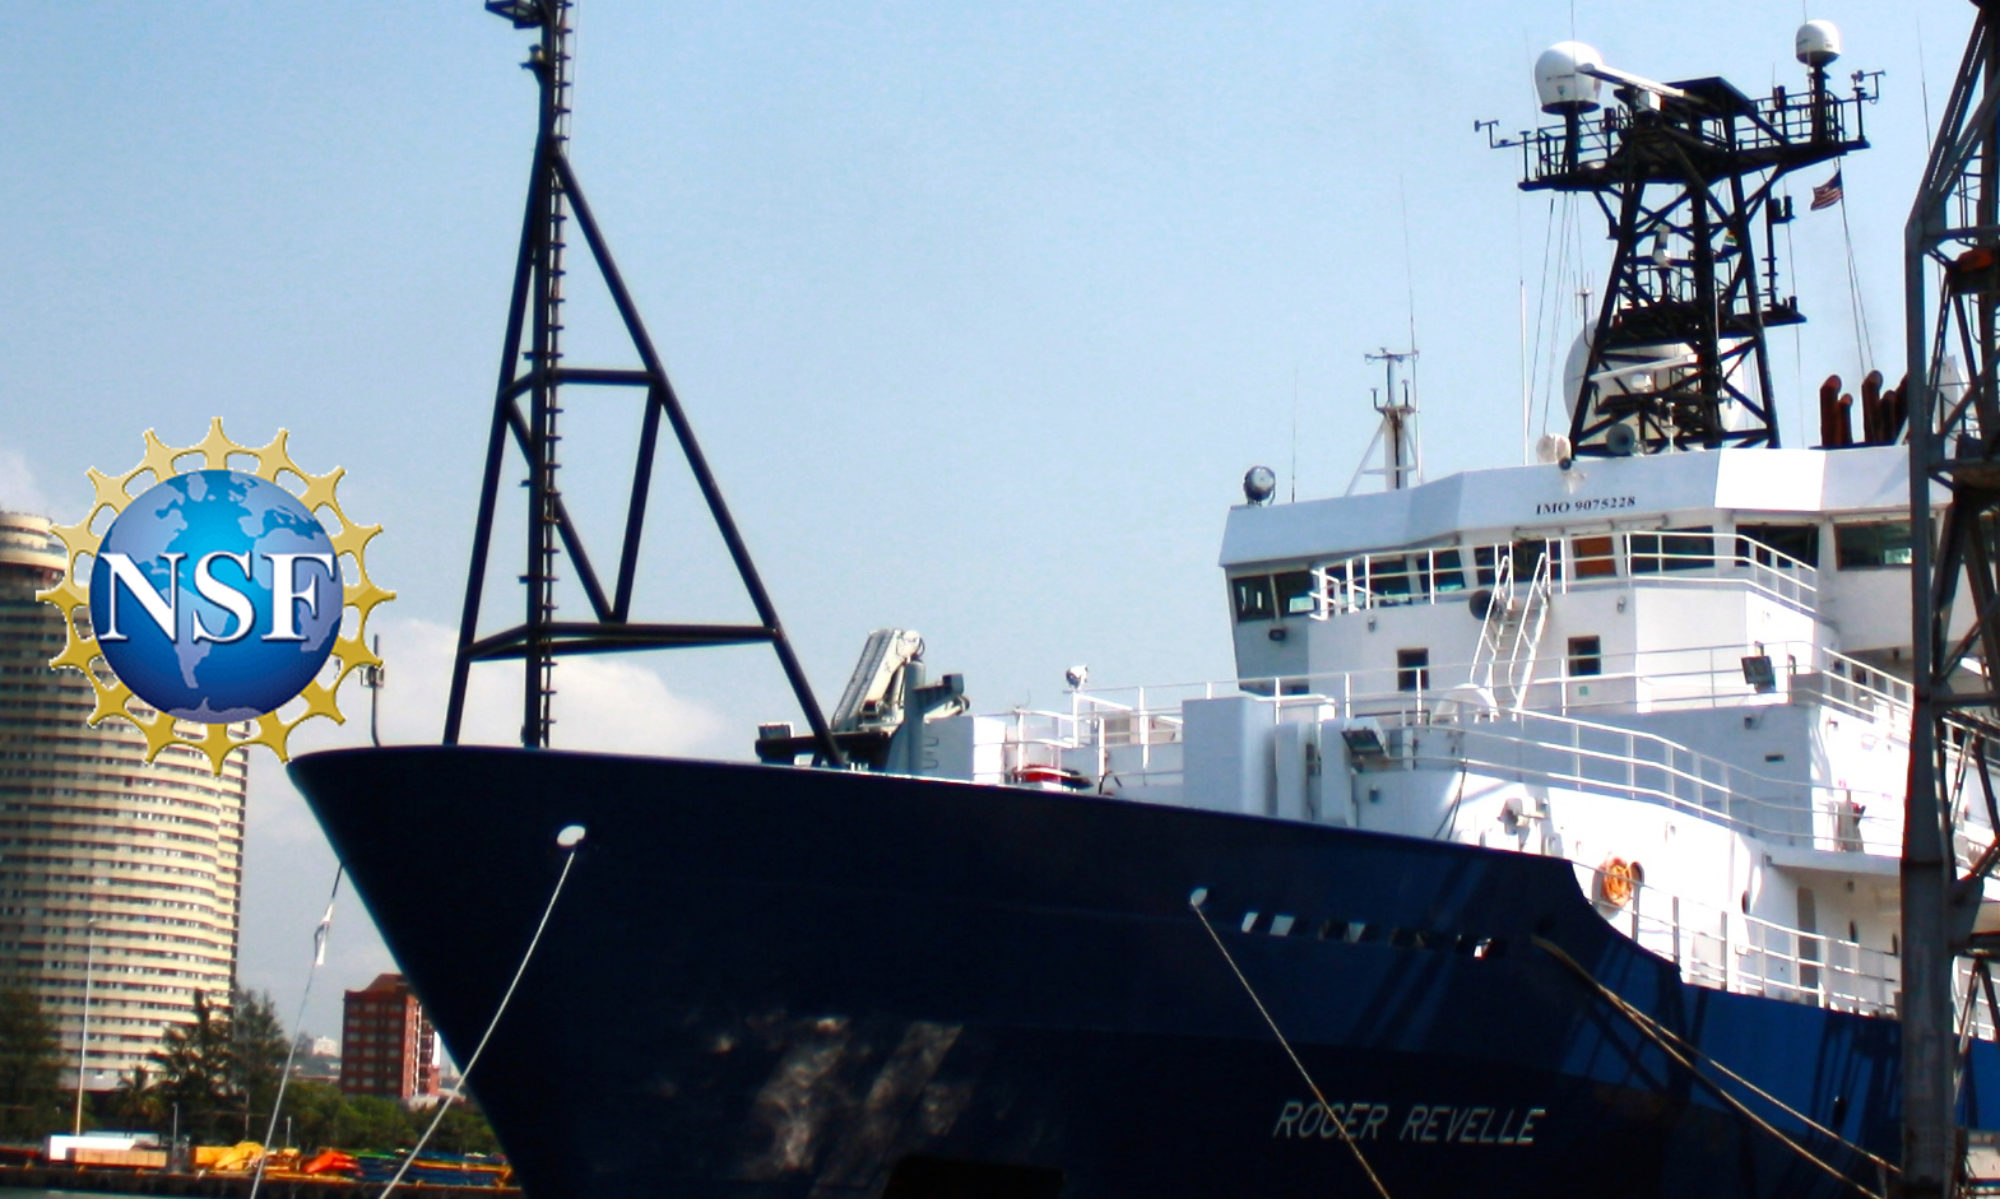
So here I am out at sea, one of a large group of rugged scientists (almost like in the movies), collecting the multibeam data we need for our map of the seafloor and the seismic data we need to find the faults that could produce a large earthquake. The ocean is pretty vast; this survey will literally be a drop in the bucket. However, every little bit of data helps us present a clearer picture of the earthquake and tsunami risk faced by the residents of Oregon and Washington State. This information is incredibly valuable because it will help us to prepare for the worst-case scenario, saving lives and property in the future.

Perhaps the most disappointing thing about disaster flicks is that there is often evidence a disaster will happen, but no one seems to take it seriously. In reality, this could not be further from the truth. Although the evidence for a large earthquake and tsunami striking Oregon and Washington is subtle, it is certainly real. We’re treating that evidence very seriously so we are not caught off guard in the future.

— John DeSanto is a P.h.D student at Scripps Institution of Oceanography

Subduction Zone Earthquakes: Insights from the Lab and the Sea

By Srisharan Shreedharan

Subduction zones are regions on the earth’s crust where a tectonic plate (usually the oceanic plate) ‘subducts’ or shears under another plate (usually the continental plate). Subduction zone earthquakes, which happen in many locations globally, can be incredibly devastating depending on their size and potential to cause large tsunamis. This is more so since many of the world’s population centers, such as San Francisco, Tokyo, and many cities in New Zealand, are situated close to subduction zones.

As a graduate student interested in the evolution of subduction ‘megathrusts’ or large subduction zone earthquakes, I study them by conducting small-scale rock friction experiments. I am looking at how friction is different in various locations along the subduction zone and what this means for future earthquakes in these regions.

Srisharan Shreedharan keeps an eye on the seismic data acquisition monitoring system during the Early Career Seismic Training Cruise. Photo: Rebecca Fowler

Earthquakes occur on faults, which are simply the interface between the two plates, in the context of subduction zones. Faults, with their not-so-smooth surfaces, thick sediment layers, and fracture zones display a variety of frictional behaviors. Frictionally, faults can be velocity strengthening or weakening. This means that with an increase in fault slip speed (like during an earthquake), the friction of velocity strengthening faults increases. This prevents an earthquake from further propagating because there is now an increased resistance to sliding on the fault. On the opposite end, velocity weakening faults have reduced friction values as their speed increases, and they further promote earthquake rupture, which can grow into very large hazards. If these quakes occur on oceanic faults, the earthquake can even reach the seafloor and create large tsunamis like during the 2011 Tohoku earthquake and the 2004 Sumatra earthquake.

Equipped with this knowledge, I conduct experiments in my lab where I shear, or slide, two small pieces of rock against each other and change their relative velocities to observe how they behave frictionally. I conduct my experiments in a large hydraulic press, which is essentially two hydraulic rams providing a force along the rock-rock interface and perpendicular to it. Sometimes, this results in the creation of stick-slip instabilities, which are really cool small-scale manifestation of earthquakes (or labquakes!).

There is evidence (based on the type of experiments I described earlier) that smectite, a type of clay, exhibits velocity weakening behavior over the pressure – temperature regimes necessary to propagate earthquake rupture near the seafloor close to the subduction zone. Scientists have studied subduction zones around the world for many decades now, and they have recently discovered that not all subduction zone earthquakes reach the seafloor. Based on these two observations, my work here at the Cascadia Margin is to image beneath the seafloor at different locations along the margin. I am looking for changes in fault structure over time. To do this, I plan to re-survey a region, which was last surveyed over two decades ago. Fault displacement/shift, if any, will give me more insight into how close to the seafloor the earthquakes from the past 20 years may have propagated. My survey line also goes over a scientific site that was last visited over 40 years ago.

I will combine the new seismic data from this survey with the existing data to accurately describe the many layers of rock and sediment that will invariably show up in my sub-sea floor images. I plan on using these datasets as a baseline to comment on the presence/absence of sediment layers (eg. smectite) in other seismic images acquired during the cruise. This will help me make an informed judgement about the potential for large tsunamis at various locations along the west coast.

In many ways, laboratory and field studies go hand in hand, especially in the context of earthquakes. Not all kinds of data can be collected in the field due to time constraints, instruments sometimes break down and there are field constraints such as bad weather. Experiments conducted on a much smaller scale provide us with the flexibility of exploring a larger set of parameters to explore. This helps build an intuitive understanding of how larger scale hazards like earthquakes and tsunamis work in nature. It also helps us build testable hypotheses and theories that we can back up — or refute — based on field scale observations. Ultimately, these experiments and studies help us, as a population, build better early-warning instruments, create more robust building codes in extremely earthquake-prone areas, and create tsunami resistant structures in coastal areas.

— Srisharan Shreedharan is a Ph.D. student at Penn State University

Déjà Vu and Deeper Views

By Brendan Reilly

Greetings from the Oregon Margin. This isn’t my first time here. In June 2017, I sailed on another expedition, Oceanus cruise 1706B, organized by fellow Early Career Scientist (ECS) Seismic Cruise participant Mo Walczak, to collect sediment cores, which have layers of sediment, or mud, that have accumulated on the seafloor. The cores we were after on that expedition would contain an environmental history of the Columbia River watershed going back over ten thousand years.

We recovered around 5-10 meters of mud from a number of locations. Each layer in these sediment cores represents a period of time slightly older than the layer above it and records information about the environmental conditions of that time. Reconstructing these conditions will build on our understanding of the relationship between Pacific Northwest water resources, ecosystems, and environment and Earth’s climate during times warmer and cooler than present.

Oregon State University graduate student Heather Bervid and Harvard University graduate student Tamara Pico helping to collect a jumbo piston core during Oceanus Cruise OC1706B. All images: Brendan Reilly

As on this current expedition, the researchers in the Oceanus science party were almost entirely early career scientists, including three Research Experience for Undergraduates (REU) students, one undergraduate who missed her graduation ceremony to participate, seven graduate students, and two post-docs. In the months since returning with those cores, the REU students have studied the microfossils, physical properties, and geochemistry of these sediments. These preliminary data indicate that many of the basins we cored contain high resolution records of Columbia River discharge and past oceanographic conditions of the Oregon Margin.

Figure 1: (left) A CT scan of a sediment core collected during RV Oceanus Cruise OC1706B from the Oregon Margin. This CT scan was collected on a medical CT scanner at the Oregon State University College of Veterinary Medicine and shows massive, high accumulation rate mud, free of turbidity currents. (right) Map of the Oregon and Washington margin indicating the approximate location this core was recovered relative to the Columbia River.

We used these initial data to target the most promising sites for survey with the Scripps Multi-Channel Seismic (MCS) system during the ECS Seismic Cruise. Our initial results suggest that these basins contain hundreds of meters of sediments, potentially extending back millions of years. This is significantly deeper than the subbottom profiles we were able to image with the ‘chirp’ subbottom imaging system we used previously. The chirp uses a higher frequency sound wave than the MCS system we are using during ECS Seismic Cruise. This allows for a higher resolution image of the upper tens of meters, but it cannot penetrate as deep as the lower frequency MCS system.

A challenge we’ve encountered is finding sites with high accumulation rates of mud, without much influence by erosive turbidity currents, or flows of sediment that travel downslope on the seafloor. Their deposits, turbidites, have been useful in investigating the earthquake history of the Pacific Northwest, but can complicate interpretation of sediments for environmental history. Careful survey, like we did in June 2017 and are doing during the ECS seismic cruise will help identify the perfect sites for further work.

Oregon State University postdocs Ben Phrampus and Mo Walczak checking out seismic images of a slope basin during the Early Career Scientist Seismic Cruise RR1718.

We have learned a lot so far about the nature of the deeper Oregon Margin sedimentary deposits from the ECS Seismic Cruise and have started discussing our plans for the next steps to investigate them further. A rewarding aspect of the cruise has been developing new research questions that could be addressed collaboratively with my fellow ECS participants in the future. While this project is a large undertaking, ultimately, what we learn will contribute to our understanding of how the Pacific Northwest has changed in the past and how that information can be used to plan for changes that may happen in the future.

— Brendan Reilly is a Ph.D. student at Oregon State University

Twilight Time

By MItch Lyle

Forty-four years ago this month I first went to sea for science; now I am on about my fortieth research expedition. It’s a long process to explore and map the seafloor. I’ve spent my entire career on this research and am now passing the torch by helping to train the next generation.

I watch the young scientists here on the R/V Revelle for their first expedition and think back to my early trips. The objectives of this expedition are to gather important data on how the Oregon continental margin is constructed and also to pass practical experience to the younger scientists. Gathering data at sea is a different skill set from working in the lab or on land: things break, time is short, and ship time is expensive and hard to get. Scientists must learn to be flexible but still get the critical scientific information they need.

Mitch Lyle talks with graduate student Emily Schottenfels in the computer lab on the R/V Revelle. Photo: Rebecca Fowler

On Revelle we are mapping the seafloor and using seismic reflection, or sound pulses, to image the shape of sediment layers that lie below the seafloor. The sediment geometry tells us how the sediments were deposited as they were eroded from the land. The sites we find that show the sediment has quietly accumulated are good spots for us to later return and collect sediment cores, which contain climate history going back tens of thousands of years. Since earthquakes bend and compress the sediment layers, the shape of the layers gives clues about how earthquakes happen and how they have uplifted or changed the coast.

The survey technology we use has vastly changed since 1973. The new technologies make life much simpler. GPS positioning now enables us to locate the ship to a few feet at any moment. In the 1970s we had a position fix every few hours from transit satellites but had to guess at what happened in between these. We often were actually miles away from where we thought we were, which of course was not very good for our maps.

Mitch in the main lab of the R/V Maurice Ewing during a 1997 expedition.

And, we didn’t really have computers—a smartphone is much more powerful than the big boxes we took to sea in 1973. So, everything was recorded on paper and perhaps digitized later. Yet scientists still use the paper traces of seismic reflection records we collected then because for many places, these 40 or 50-year-old paper records are the only data available on a given location. To use these data, we scan the records into special programs and orient them with respect to newer digital data like we are collecting today.

In 1973, we mapped the seafloor with an echo sounder, which gave us one line of soundings directly beneath the ship. Then we’d digitize the depth to the ocean bottom at 5-minute intervals from the paper records while we were off watch. The chief scientist for the project would look over our work and hand it back to us to do over again if we were sloppy. Today, we use a process called swath mapping, where we can get a fan of depths from 120 spots on the seafloor simultaneously and can map for more than a mile on either side of the ship. As the ship follows the planned track line, it paints a map of the seafloor that’s wide enough to cover an entire submarine (underwater) volcano. These data are recorded to computer servers on board and their positions are referenced automatically. Still, hands are needed to sort through the data files, edit the traces, and remove fliers. It isn’t all automatic.

I am impressed how the young scientists can adapt to the digital world, having grown up interacting with devices. They smile at the all-thumbs approach of older generations. And they jump right in to make the maps, process profiles and get done in a matter of days what used to take months of post-expedition work. Now we can go so much faster from raw data to interpretation to paper to database.

These young scientists will need such skills in their careers because close to 90 percent of the ocean has not been mapped to the scales that we need. Marine geologists get jealous of NASA researchers studying Mars, who have maps that can image to a couple of feet. Most of the ocean is mapped at a scale of five to ten miles—enough to find the big seamounts and trenches, but not enough to image current channels or seafloor faults. On the bright side, almost every time we go to sea we find something new, so doing marine geology is never boring.

— Mitch Lyle is a Research Professor in the College of Earth, Ocean, and Atmospheric Sciences at Oregon State University and a Principal Investigator for this Early Career Scientist Seismic Training Cruise.


Daily Cruise Report | Day 272

Daily Summary: R/V Revelle completed MCS lines 9-13 with one sound source and one compressor; the multibeam and echosounder were synced to improve data quality. At 02:31 UTC, a possible gas seep was noticed in the multibeam data. The sound source was turned off at 4:15 UTC for about 10 minutes for compressor maintenance. Multibeam was turned off at 4:45 UTC for 2 hours during a turn in shallow water which was causing poor data quality. Once in deeper water, the multibeam was turned on again for the remaining lines. The magnetometer was deployed at 10:16 UTC and recovered at 5:33 UTC in preparation for the MCS recovery. MCS recovery lasted 03:03 from 04:42. By 05:07, the MCS, multibeam, and echosounder were fully stopped acquiring data. R/V Revelle is now underway to WP 21 with the magnetometer collecting data.

— Emily Schottenfels, Boston University

Hunting for Hazards Beneath the Sea

By Brandi Lenz

I am a first year Ph.D. student in the School of Earth Sciences at THE Ohio State University under the supervision of Dr. Derek Sawyer. I study marine geohazards, such as submarine landslides. I have worked with high-resolution marine two-dimensional and three-dimensional seismic data from my undergraduate research projects and completed a reflection seismology course. However, I have not had the opportunity to participate in marine acquisition and processing. It is important that I gain this experience early in my career so that I have a better understanding of the data I will be working with and will be able to teach others on how it is acquired, processed, and interpreted.

Brandi Lenz on the deck of the R/V Revelle in Newport, Oregon.

Our study area for this expedition is the Cascadia Margin, and we are collecting data on it offshore Oregon. The area is tectonically active and at risk for many geohazards such as earthquakes, tsunamis, and submarine landslides. It is the perfect place for me to study submarine landslides on an active margin. Submarine landslides are similar to landslides that occur on land, but they occur underwater and are often much larger.

Scientists have noted that there seems to be an absence of slope failures or submarine landslides in the Astoria fan region, which is the northern portion of our study area. I think this is because only the bathymetry, or changes in the depth of the seafloor, has been measured and studied in detail, and there are not a lot of existing seismic profiles that go through the region. This means the data is probably biased to slides with distinct head scarps, the steep section of the slope from where a landslide begins to fail, and more recent events. Collecting seismic profiles is essential if we want to understand the history and frequency of these events. Seismic profiles allow us to “image” below the sea floor and will help us see older events.

The Astoria Fan has higher sedimentation rates than elsewhere along the margin. It consists of mostly clay and silty-clay sediments. Large landslides usually occur in areas of weaker fine-grained sediment and have the potential to create or enhance tsunami events. My hypothesis is that landslides will be less frequent outside the fan due to a lower sedimentation rate, which allows seismic strengthening to occur. Seismic strengthening can increase the shear strength of sediments by exposing them to low-magnitude earthquakes. This causes the sediments to become stronger or more consolidated over time, and therefore less susceptible to submarine landslides.

It is a delicate balance though. Earthquakes are also considered to be one of the main triggers for these underwater landslides. Seismically strengthened sediments can still fail, but it’s more than likely this would require a higher magnitude earthquake. Seismically strengthened sediments probably have a different style of failure. They likely fail in a more blocky cohesive way, which is important to understand because they could have the potential to create tsunamis. Other scientists have already identified and characterized several submarine landslides on the Cascadia Margin, especially the southern portion of our study area. It includes a known, large-scale slope failure, the Heceta slide, which is believed to have produced a large tsunami.

Figure illustrates how a submarine landslide can produce a tsunami. Courtesy of Iran PetroTech

Once seismic profiles are acquired inside and outside the fan, we can identify submarine landslides in the subsurface to get an idea on how frequent these events actually are. Seismic strengthening has not thoroughly been explored with seismic data yet, so I am excited to see what we can learn from it. Also, we are going to have a few seismic profiles of the Heceta slide and a nearby slump feature. I am hoping these profiles will help us better understand this large catastrophic slide and the mechanisms associated with its failure.

This research opportunity has benefited me greatly and will help advance my developing career as a scientist and educator. The expedition has given me valuable experience that will assist me with my continuing research in marine geohazards and provide me with interesting data I can use in my dissertation. This whole expedition has been life changing, especially since I have lived in land-locked areas my whole life and never spent any time out at sea. I finally know what it’s like to be on a research vessel (and get seasick!), acquire and process seismic data, and collaborate with other scientists with different backgrounds and point of views. If I had to describe this seismic training cruise in one word it would be “AMAZING!”

— Brandi Lenz is a Ph.D. student at The Ohio State University

Plate tectonics, subduction zones, and seismic reflection profiling: My research de-jargoned

By Emily Schottenfels

This post is for those who would like a basic explanation of why I’m on a research ship off the coast of Oregon.

Deploying seismic instruments from the R/V Revelle. Photo: Rebecca Fowler

The 2011 magnitude 9 earthquake off the coast of northeast Japan was the largest recorded earthquake in Japan’s history. The U.S. Pacific Northwest (PNW) is prone to similar large earthquakes (recall the New Yorker article, “The Really Big One”).

As a graduate student, I research the geology of these two regions. I spend a lot of time staring at “images” on a computer screen to understand how the geology below the seafloor can allow for large earthquakes, which are often followed by tsunamis. I’m now located on the R/V Roger Revelle off the PNW coast where I’m learning firsthand how to take these images of earth’s subsurface, and to successfully plan and execute a research expedition. Here’s a breakdown of the science behind this expedition.

The earth’s crust is cracked and composed of several moving pieces called “plates.” The plates move around, and the type of interaction defines the plate boundary. Generally, plates can (1) move away from one another (divergent boundary), (2) move towards one another (convergent boundary), or (3) move side by side (strike-slip or transform boundary, i.e. San Francisco). Continents are on “continental plates” and oceans are on “oceanic plates.” Geologists are sometimes good at naming things.

Earth’s plates. Credit: USGS

Oceanic plates are denser and thinner, and in convergent boundaries they can slide beneath continental plates, also called a “subduction zone.” However, the plates don’t just slide continuously over time. The plates stick to each other, build up energy, and release the energy in bursts — these are the large earthquakes. These types of plate boundaries, where Japan and the PNW are located (also places like Chile, Mexico, and New Zealand), create the largest earthquakes. Our current location off the coast of the PNW is where the Juan de Fuca (oceanic) plate slides beneath the North American (continental) plate. I’m trying to take a snapshot image of this geologic process.

When subduction zone earthquakes occur, the front of the upper continental plate moves upward and forward. The entire water column above and in front of the seafloor, which can be up to thousands of square miles, moves with the plate, resulting in a tsunami.

GIF via GIPHY

The technique employed to image the geology below the seafloor is called “seismic reflection profiling.” This process is comparable to the process of creating an ultrasound image. The research ship tows an acoustic source, in this case compressed air. The source releases and receives the compressed air (energy), and records the amount time it takes to reach the seafloor, layers below the seafloor, and return to the surface. We compile this data and create seismic images of the subsurface geology up to a few kilometers below the seafloor.

Diagram of a ship towing an acoustic source. Credit: USGS

My graduate school research involves studying and interpreting seismic images from Japan and Cascadia (the PNW) to understand how these plate boundaries evolve over time. Taking part in the acquisition and processing of this data has changed my entire perspective on my research, and my career. I’ve now been on deck to observe the acoustic source deployment process, I’ve logged and processed data, updated the track plan and communicated this information with the ship captain, and created daily maps and reports. I will eventually be able to use the data we collect for my own research project. It’s been an incredible experience making this science happen — like the art student who studies and interprets art, who then learns to paint and plan his or her own art installation for an exhibit.

Thank you to the National Science Foundation for making this expedition happen.

— Emily Schottenfels is a Ph.D. student at Boston University. Follow her on Twitter @emilyrschott, along with #SeismicECS


Daily Cruise Report | Day 271

Daily Summary: R/V Roger Revelle continued operations for MCS Line 4. We finished troubleshooting the magnetometer and deployed it at 00:27 UTC. The magnetometer began logging at 01:17 UTC. There was an issue with the one functional compressor at 4:50 UTC. The second compressor was up and running by 5:10 UTC. A strong bubble plume was detected on the multi-beam at 13:35 UTC. One of the sound source has had an operating issue, so we decided to obtain Lines 7 and 8 with only one sound source. For quality check, we promptly processed Line 7 data and ensured that we have acquired quality data with 2 second penetration even with these issues.

— Alexis Wright, USGS/Colorado School of Mines and Casey Hearn, University of Rhode Island


Exploring Earthquake and Tsunami Hazards Along the Pacific Northwest Coast

By Valerie Sahakian

Tsunamis can be dangerous and deadly. The 2011 Tohoku-Oki earthquake and tsunami occurred offshore Japan on March 10, 2011, killing over 15,900 people, injuring over 6,000, and leaving over 2,500 people missing. The magnitude 9.1 earthquake happened in a subduction zone – where one tectonic plate slides underneath another. The Washington, Oregon, and northern California coast is next to the Cascadia subduction zone, where the Juan de Fuca plate slides under the North American plate. Studies show that this region produced magnitude 9 earthquakes and ensuing tsunamis in the past. When it comes to these hazards in the Pacific Northwest (PNW), the question is not “if” we will get one, but “when” and what we can expect for earthquake and tsunami size. The best thing to do is to be prepared – and learn more about hazards in the PNW by studying the science of these phenomena.

Images from sms-tsunami-warning.org of the 2011 Tohoku-Oki tsunami in Japan. Tsunamis look more like fast-moving tides, not breaking waves.

Not all large earthquakes create tsunamis as big as the one in Tohoku. Can scientists determine how likely we are to have a tsunami along different parts of the PNW Coast and how big it would be? What types of things affect whether an earthquake is likely to cause a large tsunami? (Or none at all?)

On this expedition, we are collecting seismic data to answer these questions. The seismic data we acquire give us an image of what’s beneath the seafloor – like a vertical slice through it, from the seafloor down. We can use this image to look at the properties of the clay, or “sediment” beneath the seafloor, such as how thick it is, and where it is. Why does this matter for tsunamis? Tsunamis happen when the seafloor is moved abruptly – for example when an earthquake or an underwater landslide occurs. The more the seafloor moves, the larger a tsunami we expect.

Some earthquakes are contained much deeper in the earth, whereas others will break to the surface, in effect moving the seafloor. There is some evidence from Japan and Tohoku-Oki that the amount of sediment at the boundary between the two plates (the “incoming plate”, which is sinking, and the “overriding plate,” above it) may affect whether or not an earthquake breaks all the way to the surface. Scientists studying the Tohoku earthquake have found that the seafloor moved the most (in some places 50 meters – about 165 feet!!) in an area where there was thicker sediment between the two plates. With the seismic data we collect, we can map out where in Cascadia there is more sediment beneath the incoming plate and the overriding plate, and where the sediment is thinner. This map of sediment thickness can help us learn more about where larger tsunamis might be expected in Cascadia.

Cartoon 1 – Two sides of this cartoon show a cross-section, or slice of a subduction zone. One plate, the incoming plate, slides underneath another plate (the overriding plate). The area where these to plates meet, the “plate interface”, is where earthquakes happen (what the star marks). Some parts of subduction zones show a small amount of sediment from the ocean floor that sinks down with the incoming plate (on the left); others show a much thicker layer of sediments that subduct with the incoming plate (right).

It also seems that the type of clay in the sediment matters. Offshore Japan, scientists found a lot more of the type of clay called “smectite” in the sediments in the area where the Tohoku-Oki earthquake broke to the surface. There are some samples of sediment (“cores”) in this area, which show a variety of types of clay. We can collect seismic data over the location these cores were collected, and try to match up what we see in the seismic data with the different types of clay in the cores. In the future, with the seismic data we collect, we can also have targets of where to collect more cores to look for smectite.

Any findings from the seismic data we collect can help scientists who model earthquakes and tsunamis. If it is, in fact, more likely that some regions of the subduction zone could allow for earthquakes to break to the surface, what would the earthquake look like, and what would the ensuing tsunami look like? How high would it be, say, in Northern California vs. Central Oregon? How would this impact our schools, our hospitals, our homes? This information is crucial for understanding how to better prepare for tsunamis: How emergency responders should plan for events, how engineers and legislators can change our building codes and instate policies for disaster management, and how we can all protect ourselves from the natural hazards in our backyard.

— Valarie Sahakian is a postdoctoral researcher at USGS.

Daily Cruise Report | Day 270

Daily Summary: The science party and Shipboard Technical Support continued working to get the Scripps Portable MCS system fully operational. The MCS system was fully deployed at 00:05 UTC, at which point the ship speed increased to 5 knots to return to the planned course before testing. The first MCS check shot was at 00:25 UTC and the second seismic source was turned on with a check shot at 00:30 UTC. At 1:45 UTC the first shot of Line 1 commenced at water depth of 566m. Shot-points 377-379 seismic source 1 delta error. Poor quality multi-beam data was acquired from 3:38 through 4:23 UTC and then power cycled. XBT deployed at 5:05 UTC. Multi-beam was back online and logging at 6:44 UTC. Seismic Line 1 ends at 6:50 UTC. Seismic Line 2 begins at 6:56 UTC and ends at 8:44 UTC. Seismic Line 2T began at 9:44 and ended at 10:24 UTC. Seismic Line 3 begins at 10:44 and ends at 12:46 UTC (shot 3965) due to a compressor leak/acoustic source malfunction. Revelle crossed the Kulm Ridge at 13:21 UTC and did not observe bubbles. Acoustic source testing resumed at 20:07 UTC. Malfunction was fixed at 22:53 UTC. Successful data acquisition is now in progress.

— Ashley Long, Coastal Carolina University and Parker Sprinkle, North Carolina State University