By Emily Schottenfels
This post is for those who would like a basic explanation of why I’m on a research ship off the coast of Oregon.

The 2011 magnitude 9 earthquake off the coast of northeast Japan was the largest recorded earthquake in Japan’s history. The U.S. Pacific Northwest (PNW) is prone to similar large earthquakes (recall the New Yorker article, “The Really Big One”).
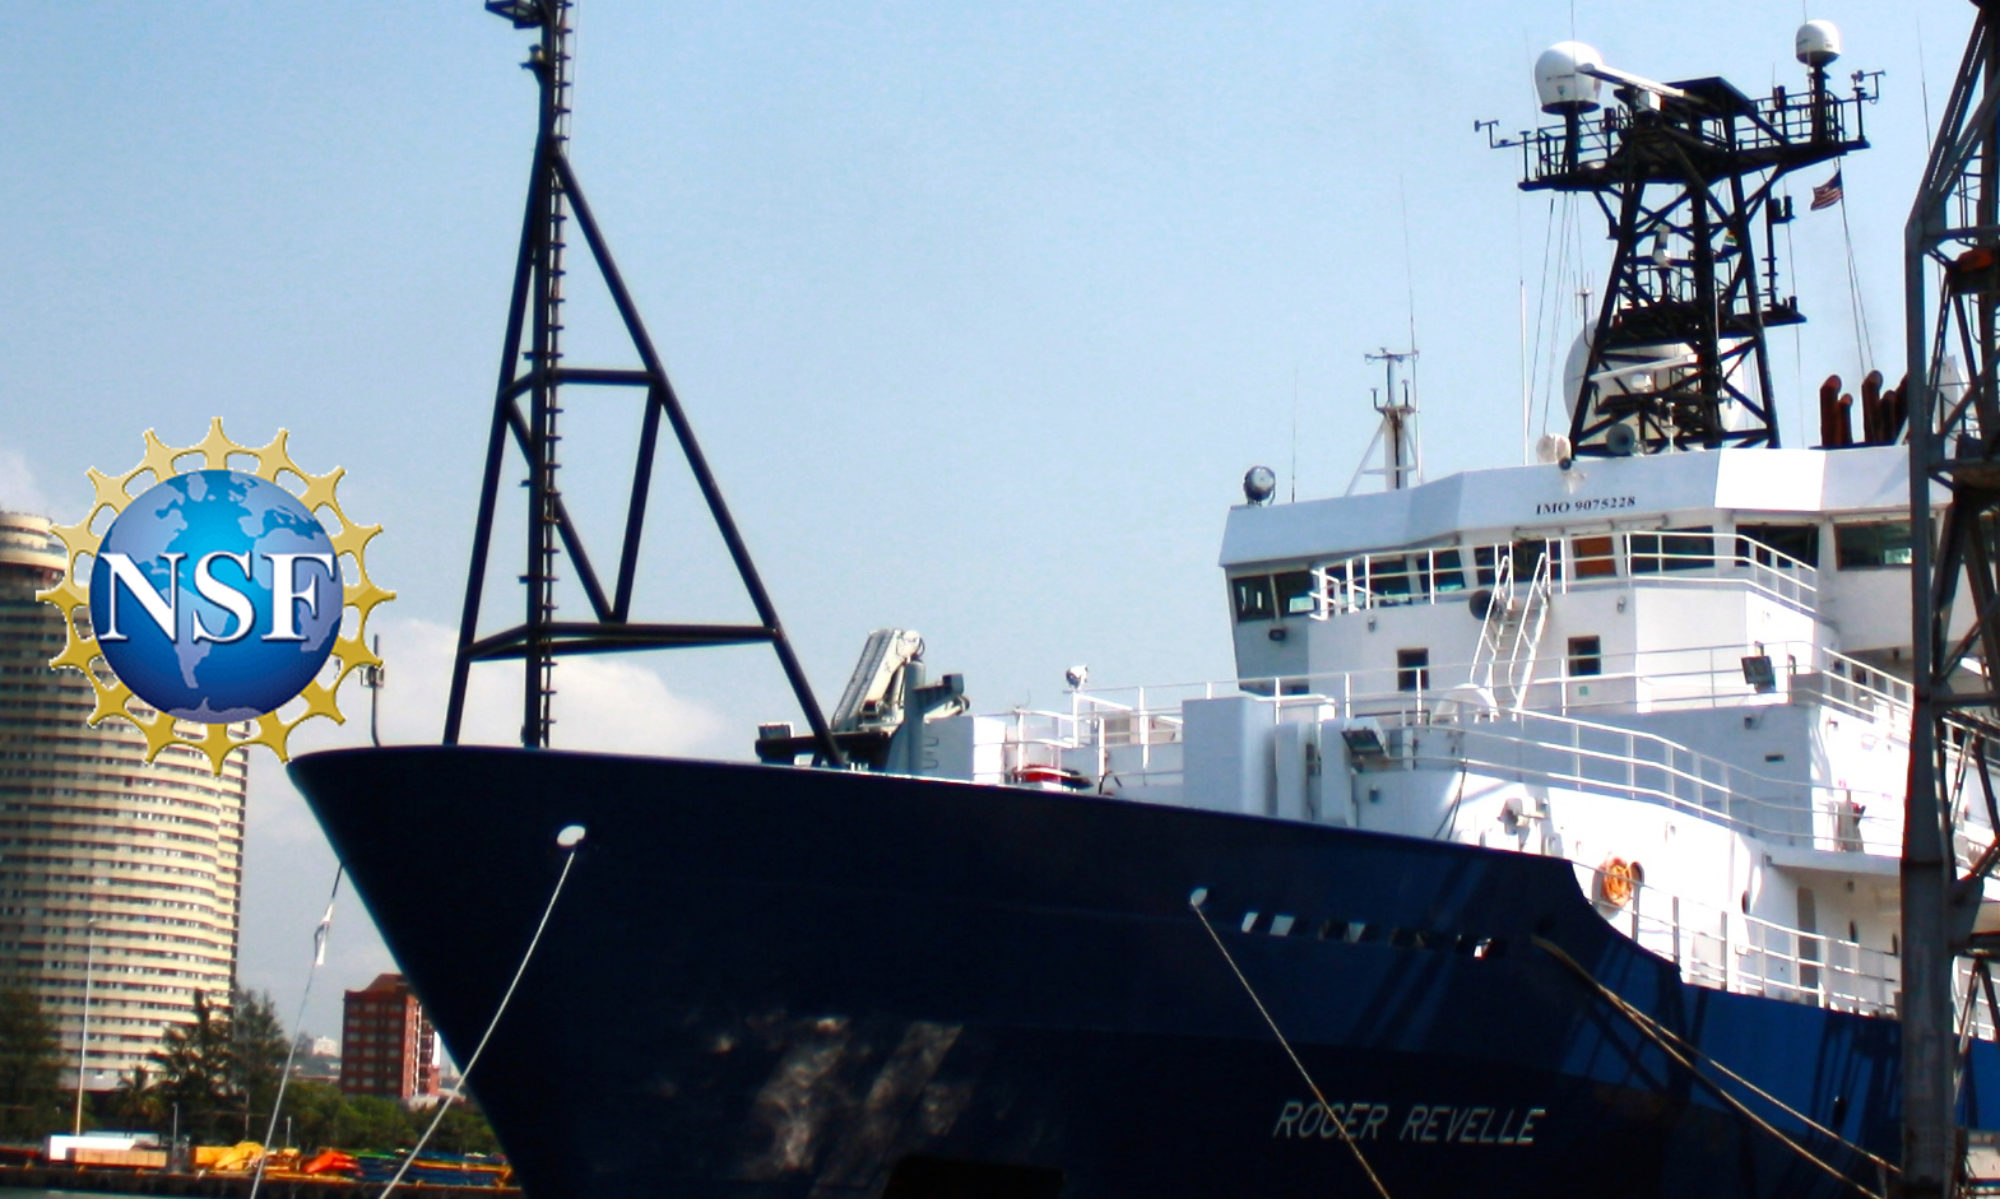
As a graduate student, I research the geology of these two regions. I spend a lot of time staring at “images” on a computer screen to understand how the geology below the seafloor can allow for large earthquakes, which are often followed by tsunamis. I’m now located on the R/V Roger Revelle off the PNW coast where I’m learning firsthand how to take these images of earth’s subsurface, and to successfully plan and execute a research expedition. Here’s a breakdown of the science behind this expedition.
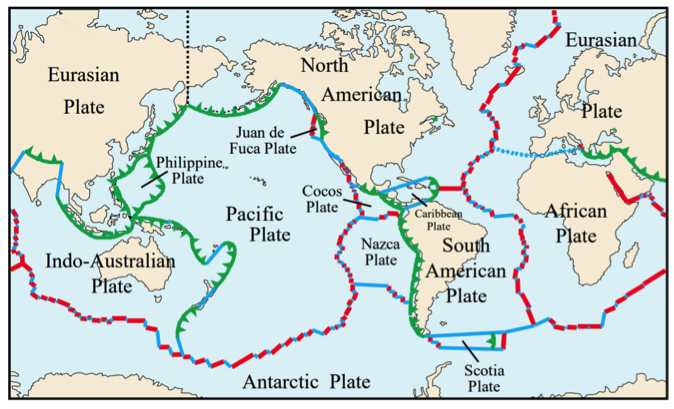
The earth’s crust is cracked and composed of several moving pieces called “plates.” The plates move around, and the type of interaction defines the plate boundary. Generally, plates can (1) move away from one another (divergent boundary), (2) move towards one another (convergent boundary), or (3) move side by side (strike-slip or transform boundary, i.e. San Francisco). Continents are on “continental plates” and oceans are on “oceanic plates.” Geologists are sometimes good at naming things.

Oceanic plates are denser and thinner, and in convergent boundaries they can slide beneath continental plates, also called a “subduction zone.” However, the plates don’t just slide continuously over time. The plates stick to each other, build up energy, and release the energy in bursts — these are the large earthquakes. These types of plate boundaries, where Japan and the PNW are located (also places like Chile, Mexico, and New Zealand), create the largest earthquakes. Our current location off the coast of the PNW is where the Juan de Fuca (oceanic) plate slides beneath the North American (continental) plate. I’m trying to take a snapshot image of this geologic process.
When subduction zone earthquakes occur, the front of the upper continental plate moves upward and forward. The entire water column above and in front of the seafloor, which can be up to thousands of square miles, moves with the plate, resulting in a tsunami.
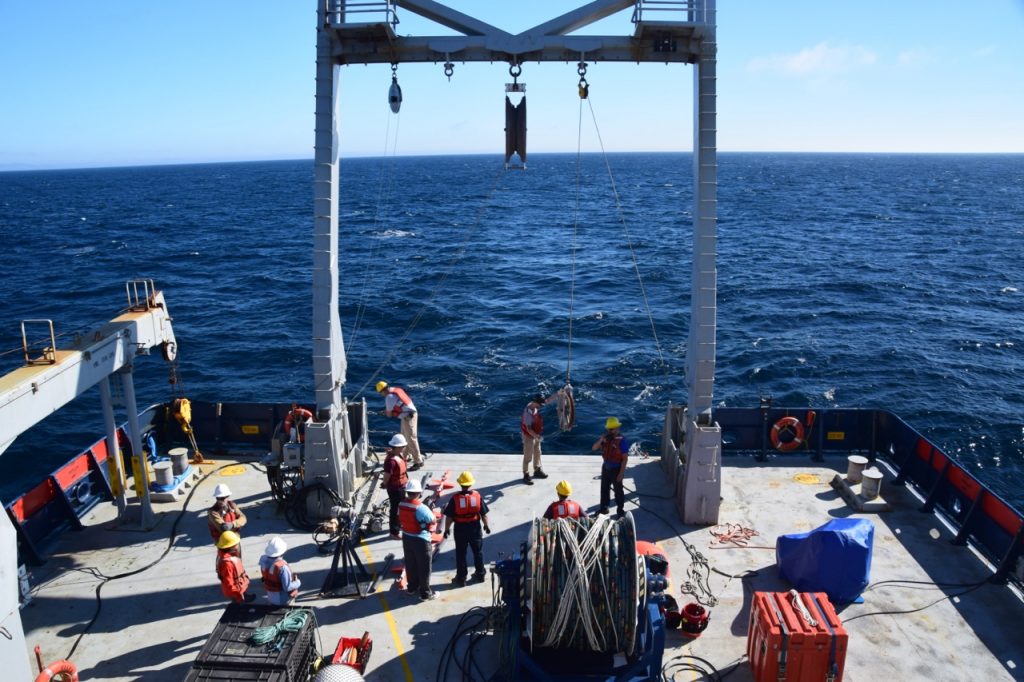
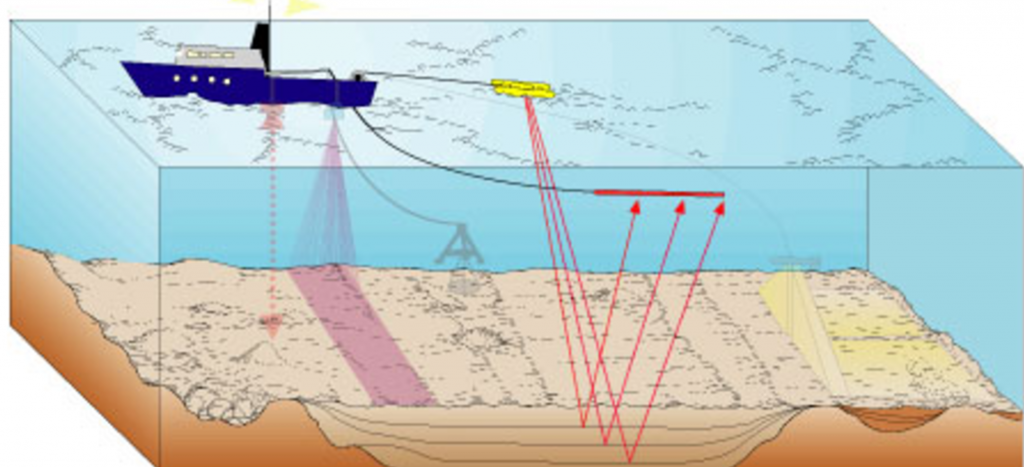
The technique employed to image the geology below the seafloor is called “seismic reflection profiling.” This process is comparable to the process of creating an ultrasound image. The research ship tows an acoustic source, in this case compressed air. The source releases and receives the compressed air (energy), and records the amount time it takes to reach the seafloor, layers below the seafloor, and return to the surface. We compile this data and create seismic images of the subsurface geology up to a few kilometers below the seafloor.

My graduate school research involves studying and interpreting seismic images from Japan and Cascadia (the PNW) to understand how these plate boundaries evolve over time. Taking part in the acquisition and processing of this data has changed my entire perspective on my research, and my career. I’ve now been on deck to observe the acoustic source deployment process, I’ve logged and processed data, updated the track plan and communicated this information with the ship captain, and created daily maps and reports. I will eventually be able to use the data we collect for my own research project. It’s been an incredible experience making this science happen — like the art student who studies and interprets art, who then learns to paint and plan his or her own art installation for an exhibit.
Thank you to the National Science Foundation for making this expedition happen.
— Emily Schottenfels is a Ph.D. student at Boston University. Follow her on Twitter @emilyrschott, along with #SeismicECS
