By MItch Lyle
Forty-four years ago this month I first went to sea for science; now I am on about my fortieth research expedition. It’s a long process to explore and map the seafloor. I’ve spent my entire career on this research and am now passing the torch by helping to train the next generation.
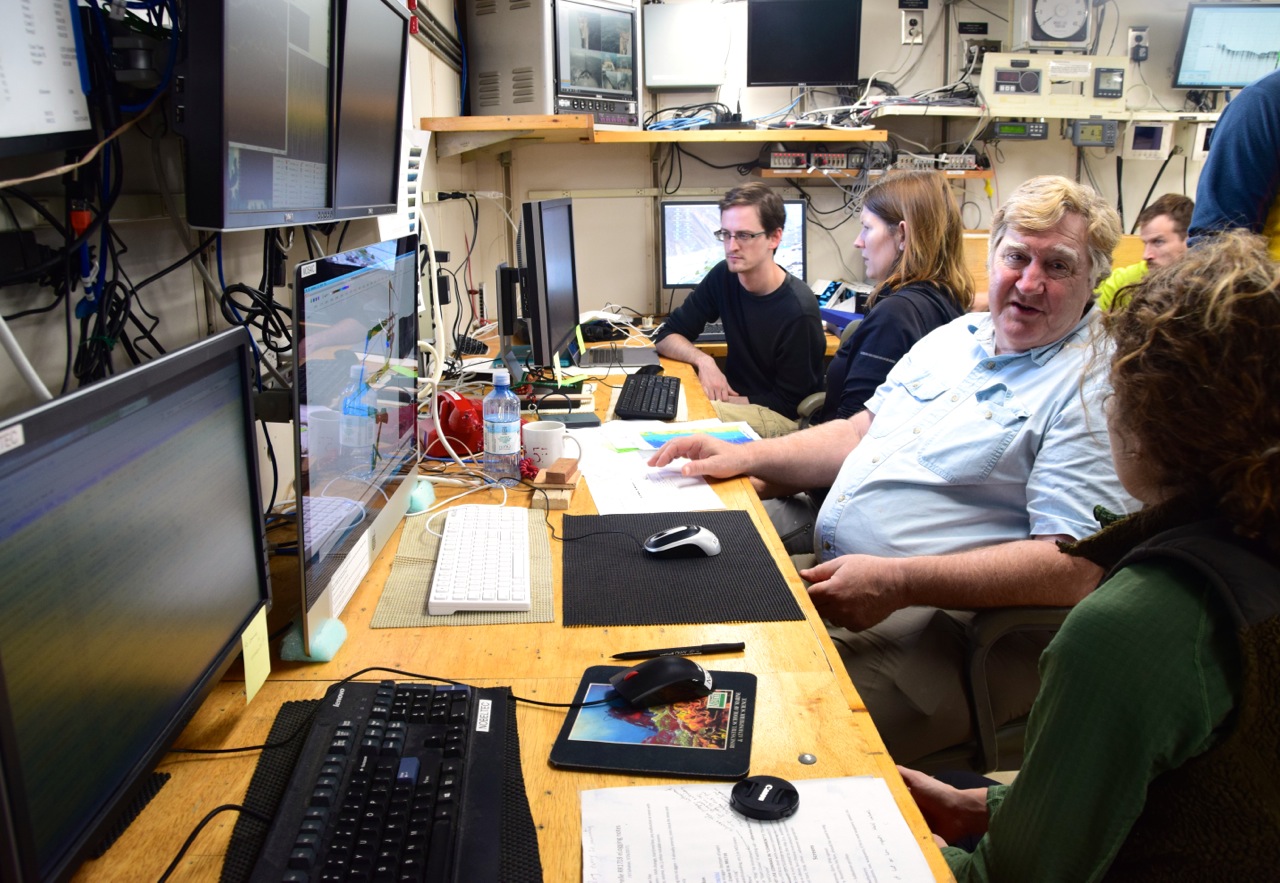
I watch the young scientists here on the R/V Revelle for their first expedition and think back to my early trips. The objectives of this expedition are to gather important data on how the Oregon continental margin is constructed and also to pass practical experience to the younger scientists. Gathering data at sea is a different skill set from working in the lab or on land: things break, time is short, and ship time is expensive and hard to get. Scientists must learn to be flexible but still get the critical scientific information they need.
On Revelle we are mapping the seafloor and using seismic reflection, or sound pulses, to image the shape of sediment layers that lie below the seafloor. The sediment geometry tells us how the sediments were deposited as they were eroded from the land. The sites we find that show the sediment has quietly accumulated are good spots for us to later return and collect sediment cores, which contain climate history going back tens of thousands of years. Since earthquakes bend and compress the sediment layers, the shape of the layers gives clues about how earthquakes happen and how they have uplifted or changed the coast.
The survey technology we use has vastly changed since 1973. The new technologies make life much simpler. GPS positioning now enables us to locate the ship to a few feet at any moment. In the 1970s we had a position fix every few hours from transit satellites but had to guess at what happened in between these. We often were actually miles away from where we thought we were, which of course was not very good for our maps.
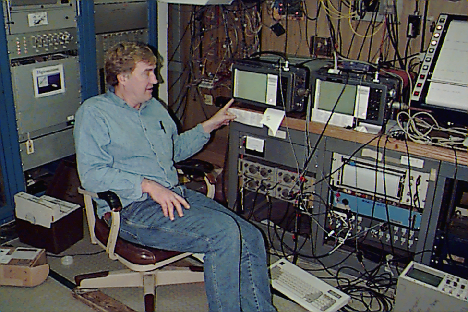
And, we didn’t really have computers—a smartphone is much more powerful than the big boxes we took to sea in 1973. So, everything was recorded on paper and perhaps digitized later. Yet scientists still use the paper traces of seismic reflection records we collected then because for many places, these 40 or 50-year-old paper records are the only data available on a given location. To use these data, we scan the records into special programs and orient them with respect to newer digital data like we are collecting today.
In 1973, we mapped the seafloor with an echo sounder, which gave us one line of soundings directly beneath the ship. Then we’d digitize the depth to the ocean bottom at 5-minute intervals from the paper records while we were off watch. The chief scientist for the project would look over our work and hand it back to us to do over again if we were sloppy. Today, we use a process called swath mapping, where we can get a fan of depths from 120 spots on the seafloor simultaneously and can map for more than a mile on either side of the ship. As the ship follows the planned track line, it paints a map of the seafloor that’s wide enough to cover an entire submarine (underwater) volcano. These data are recorded to computer servers on board and their positions are referenced automatically. Still, hands are needed to sort through the data files, edit the traces, and remove fliers. It isn’t all automatic.
I am impressed how the young scientists can adapt to the digital world, having grown up interacting with devices. They smile at the all-thumbs approach of older generations. And they jump right in to make the maps, process profiles and get done in a matter of days what used to take months of post-expedition work. Now we can go so much faster from raw data to interpretation to paper to database.
These young scientists will need such skills in their careers because close to 90 percent of the ocean has not been mapped to the scales that we need. Marine geologists get jealous of NASA researchers studying Mars, who have maps that can image to a couple of feet. Most of the ocean is mapped at a scale of five to ten miles—enough to find the big seamounts and trenches, but not enough to image current channels or seafloor faults. On the bright side, almost every time we go to sea we find something new, so doing marine geology is never boring.
— Mitch Lyle is a Research Professor in the College of Earth, Ocean, and Atmospheric Sciences at Oregon State University and a Principal Investigator for this Early Career Scientist Seismic Training Cruise.